


On-cluster metrics stack
Linkerd provides a full on-cluster metrics stack, including CLI tools, a web dashboard, and pre-configured Grafana dashboards.
To access this functionality, you install the viz extension:
linkerd viz install | kubectl apply -f -
This extension installs the following components into your linkerd-viz
namespace:
- A Prometheus instance
- A Grafana instance
- metrics-api, tap, tap-injector, and web components
These components work together to provide an on-cluster metrics stack.
Note
Operating notes
This metrics stack may require significant cluster resources. Prometheus, in particular, will consume resources as a function of traffic volume within the cluster.
Additionally, by default, metrics data is stored in a transient manner that is not resilient to pod restarts or to node outages. See Bringing your own Prometheus for one way to address this.
Linkerd dashboard
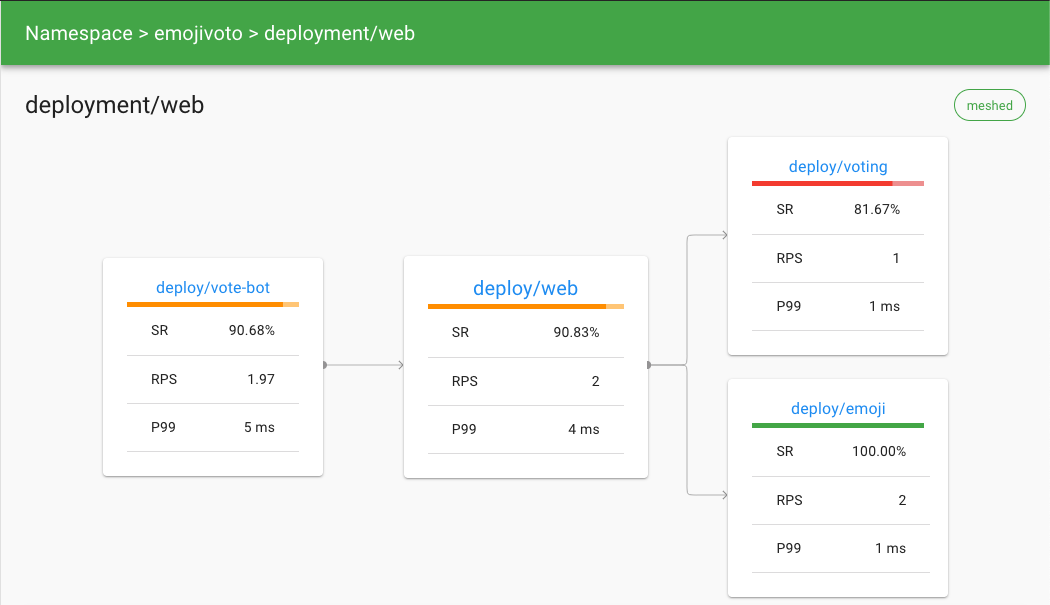
The Linkerd dashboard provides a high level view of what is happening with your
services in real time. It can be used to view the “golden” metrics (success
rate, requests/second and latency), visualize service dependencies and
understand the health of specific service routes. One way to pull it up is by
running linkerd viz dashboard from the command line.

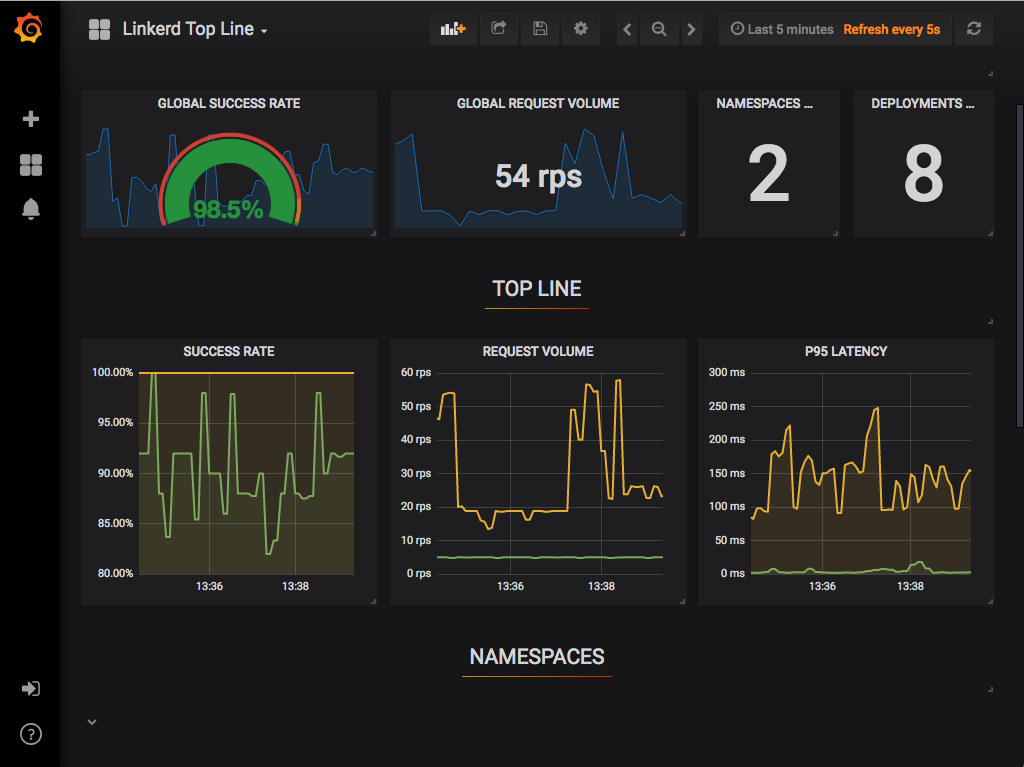
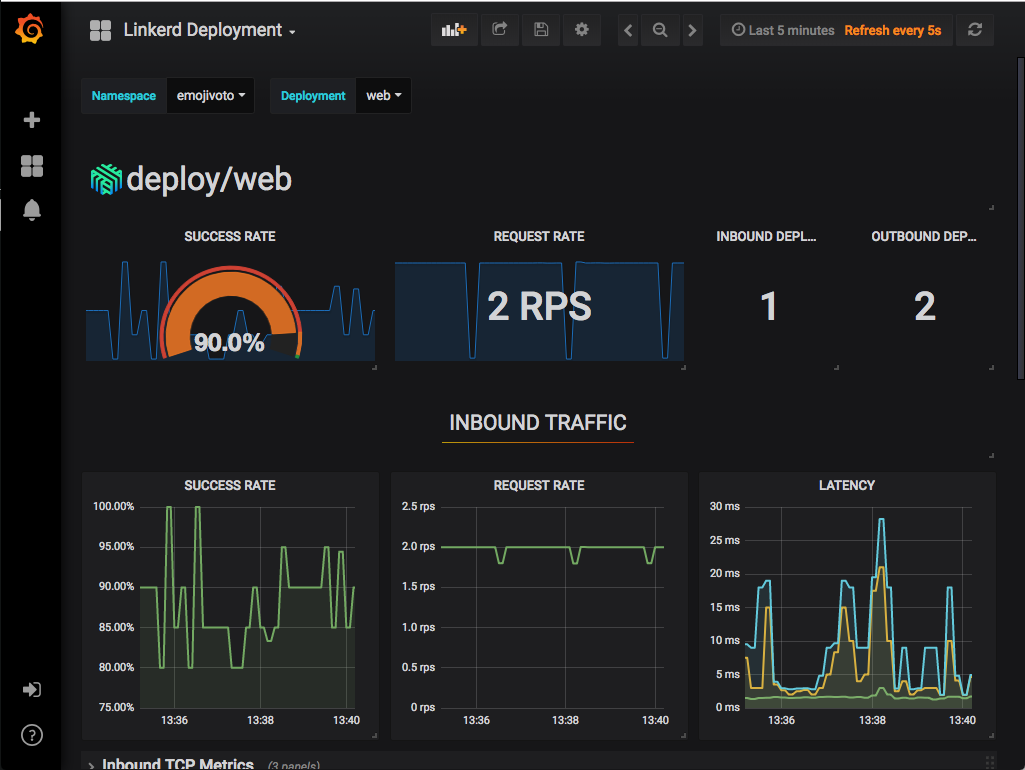
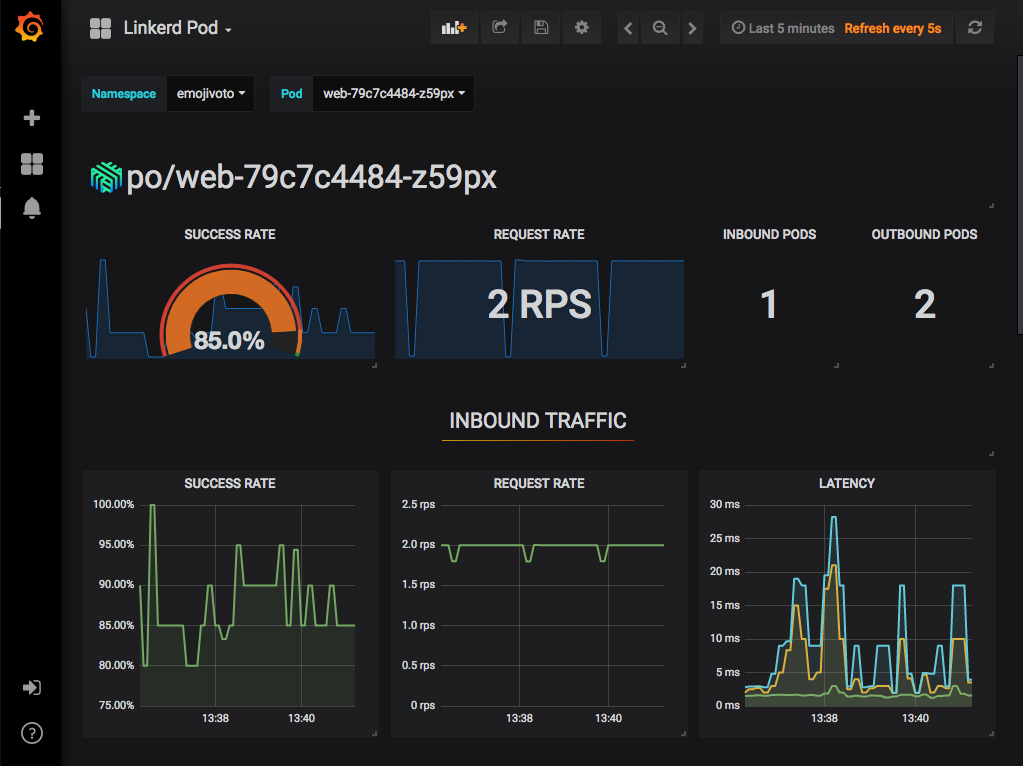
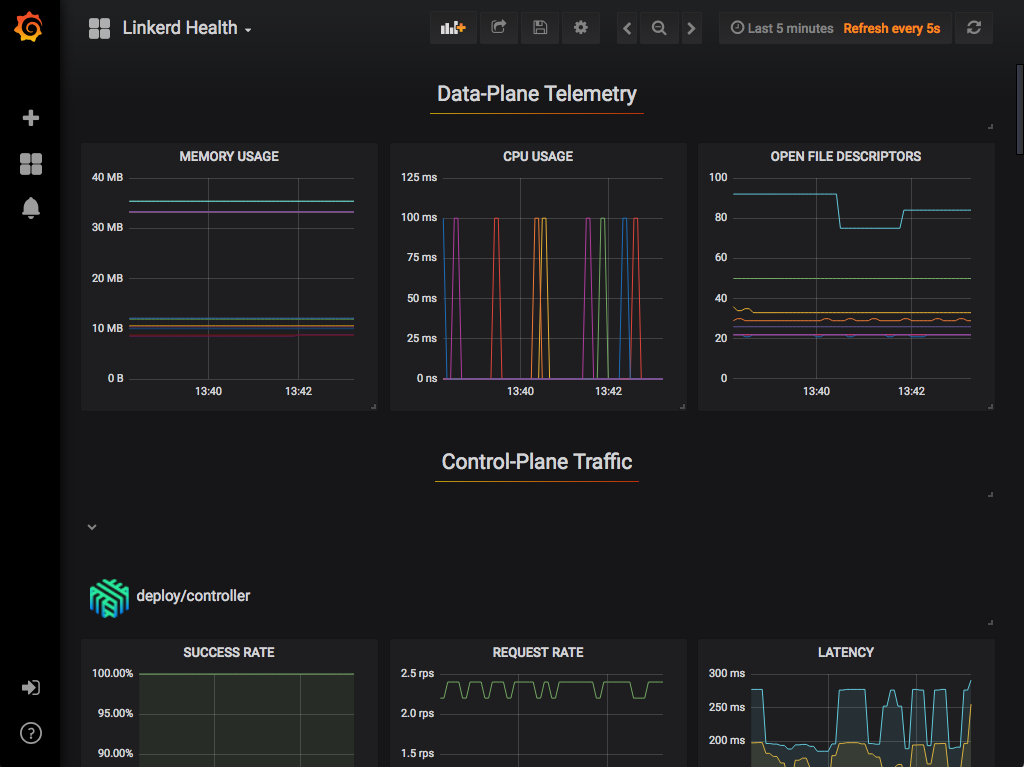
Grafana
As a component of the control plane, Grafana provides actionable dashboards for your services out of the box. It is possible to see high level metrics and dig down into the details, even for pods.
The dashboards that are provided out of the box include:
linkerd -n emojivoto check –proxy
Examples
In these examples, we assume you’ve installed the emojivoto example application. Please refer to the Getting Started Guide for how to do this.
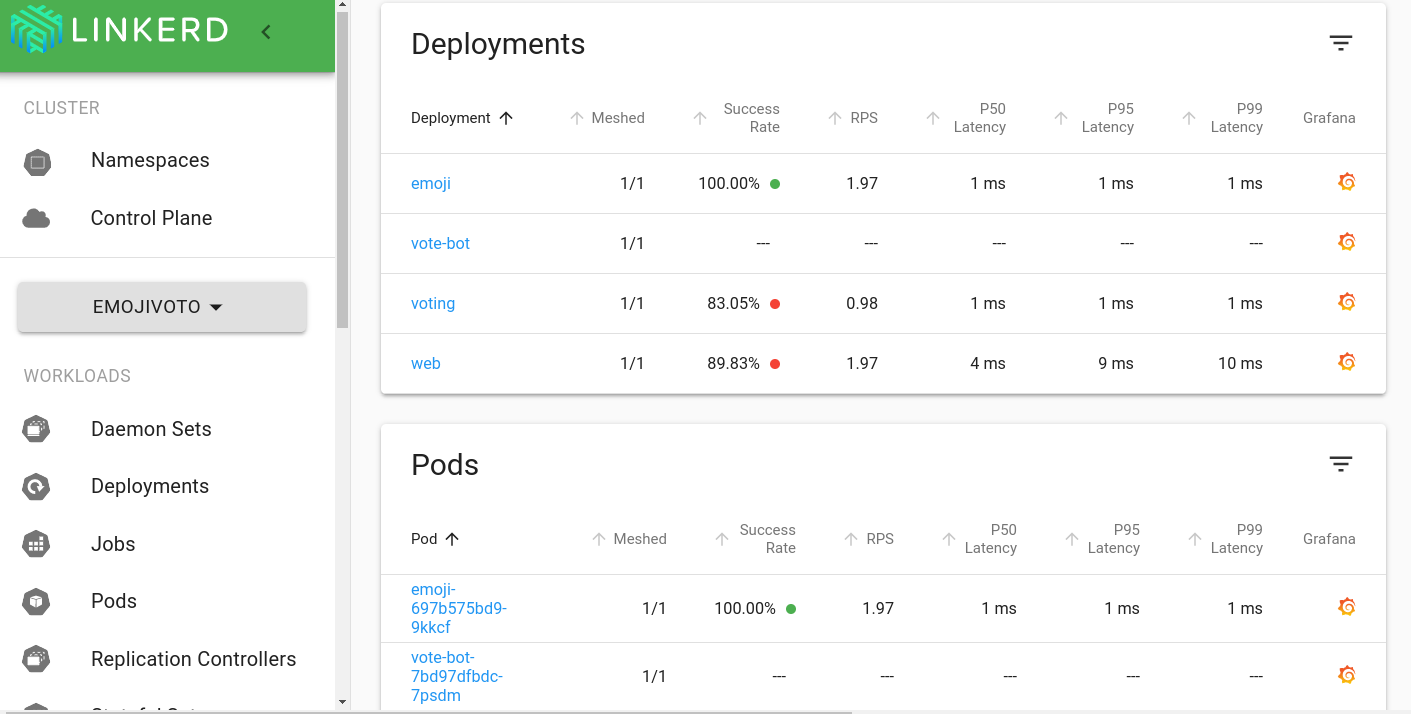
You can use your dashboard extension and see all the services in the demo app. Since the demo app comes with a load generator, we can see live traffic metrics by running:
linkerd -n emojivoto viz stat deploy
This will show the “golden” metrics for each deployment:
- Success rates
- Request rates
- Latency distribution percentiles
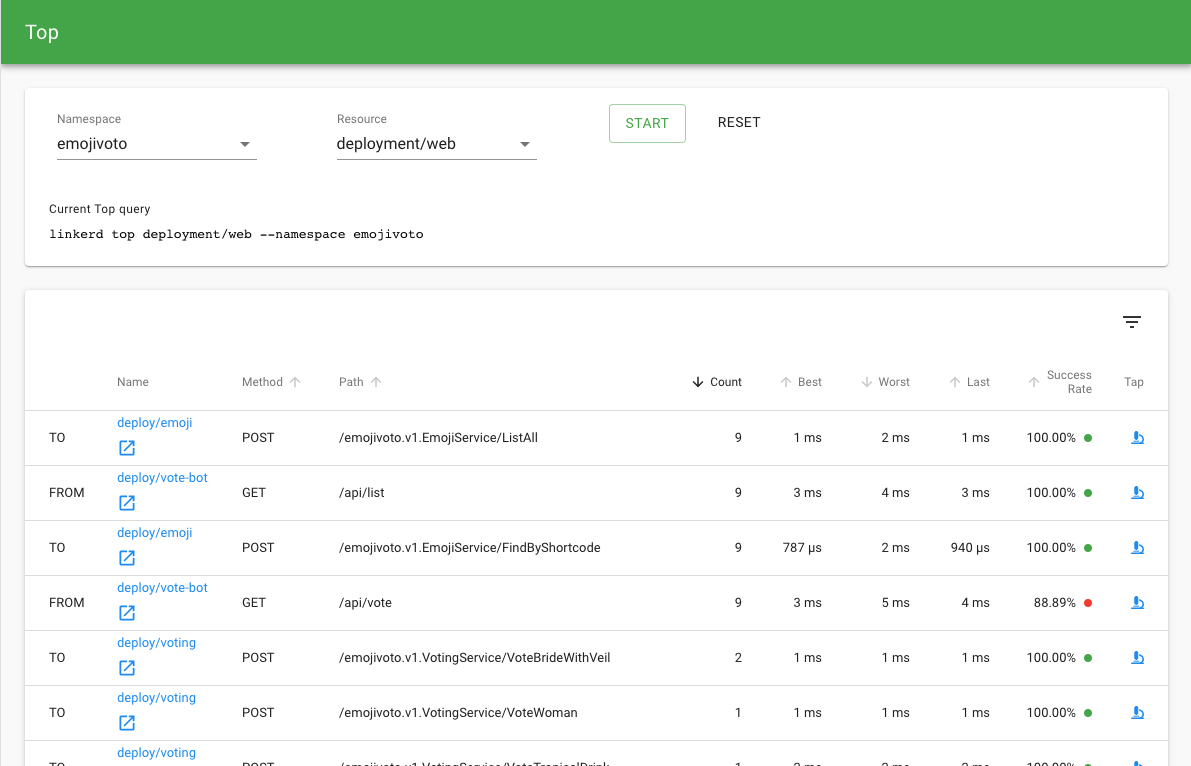
To dig in a little further, it is possible to use top to get a real-time view
of which paths are being called:
linkerd -n emojivoto viz top deploy
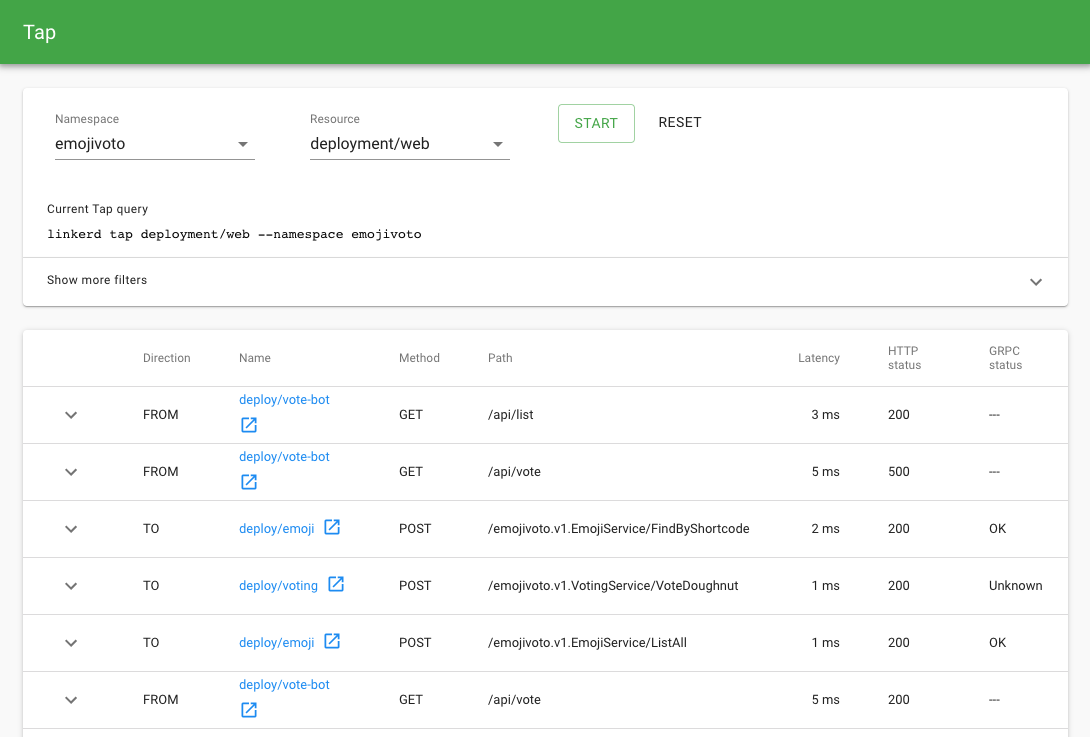
To go even deeper, we can use tap shows the stream of requests across a single
pod, deployment, or even everything in the emojivoto namespace:
linkerd -n emojivoto viz tap deploy/web
All of this functionality is also available in the dashboard, if you would like to use your browser instead: