

Architecture
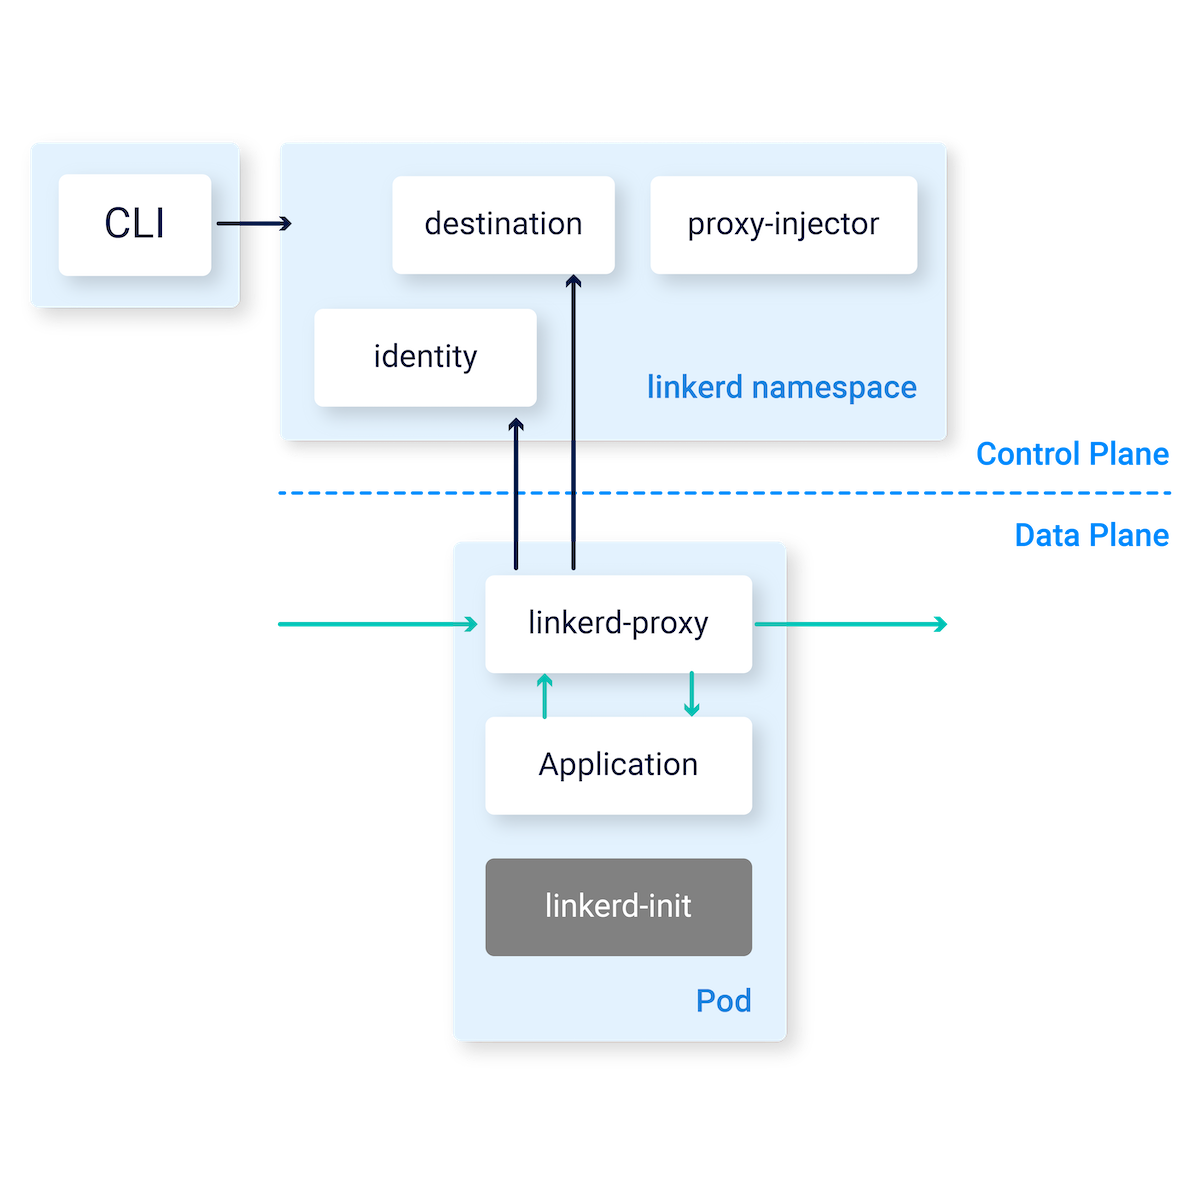
At a high level, Linkerd consists of a control plane and a data plane.
The control plane is a set of services that run in a dedicated namespace. These services accomplish various things—aggregating telemetry data, providing a user-facing API, providing control data to the data plane proxies, etc. Together, they drive the behavior of the data plane.
The data plane consists of transparent proxies that are run next to each service instance. These proxies automatically handle all traffic to and from the service. Because they’re transparent, these proxies act as highly instrumented out-of-process network stacks, sending telemetry to, and receiving control signals from, the control plane.
Control Plane
The Linkerd control plane is a set of services that run in a dedicated
Kubernetes namespace (linkerd by default). These services accomplish various
things—aggregating telemetry data, providing a user-facing API, providing
control data to the data plane proxies, etc. Together, they drive the behavior
of the data plane. To install the control plane on your own cluster, follow the instructions.
The control plane is made up of:
Controller
The controller deployment consists of the public-api container that provides an API for the CLI and dashboard to interface with.
Destination
Each proxy in the data plane uses this component to lookup where to send requests. The destination deployment is also used to fetch service profile information used for per-route metrics, retries and timeouts.
Identity
This component provides a Certificate Authority that accepts CSRs from proxies and returns certificates signed with the correct identity. These certificates are fetched by the proxy on start and must be issued before the proxy becomes ready. They are subsequently used for any connection between Linkerd proxies to implement mTLS.
Proxy Injector
The injector is an admission controller, which receives
a webhook request every time a pod is created. This injector inspects resources
for a Linkerd-specific annotation (linkerd.io/inject: enabled). When that
annotation exists, the injector mutates the pod’s specification and adds both an
initContainer as well as a sidecar containing the proxy itself.
Service Profile Validator
The validator is also an admission controller, which validates new service profiles before they are saved.
Tap
The tap deployment receives requests from the CLI and dashboard to watch requests and responses in real time. It establishes stream to watch these requests and responses in specific proxies associated with the requested applications.
Web
The web deployment provides the Linkerd dashboard. This does not require running
linkerd dashboard and can be exposed to
others.
Heartbeat
This CronJob runs once a day and records some analytics that help with the development of Linkerd. It is optional and can be disabled.
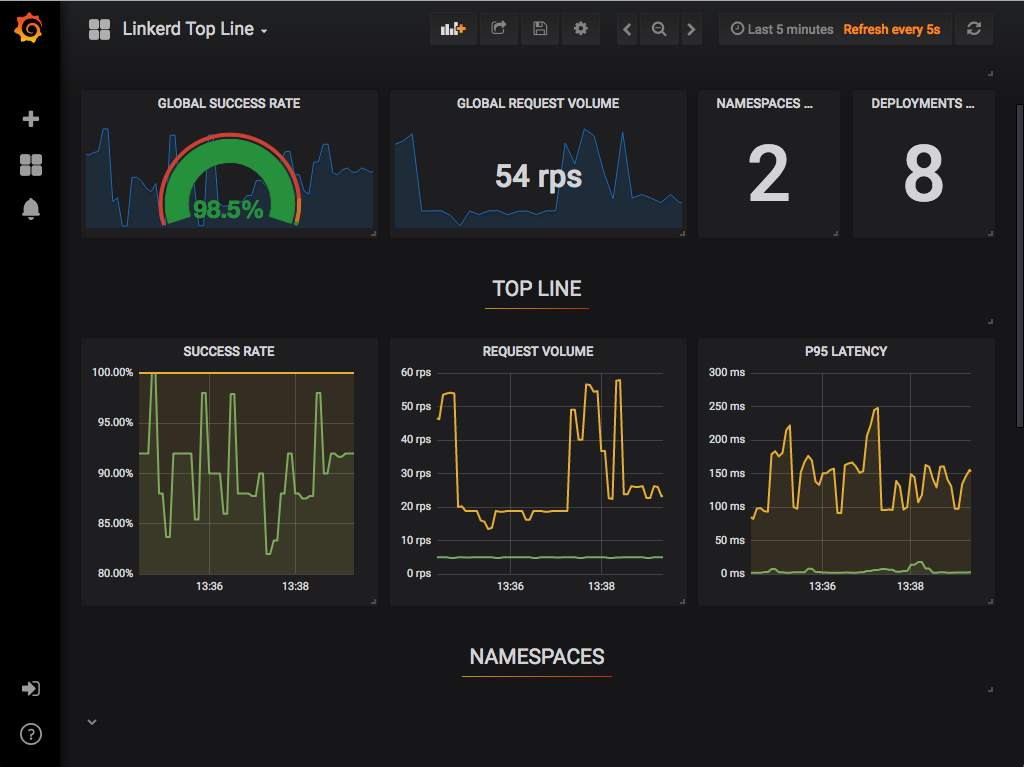
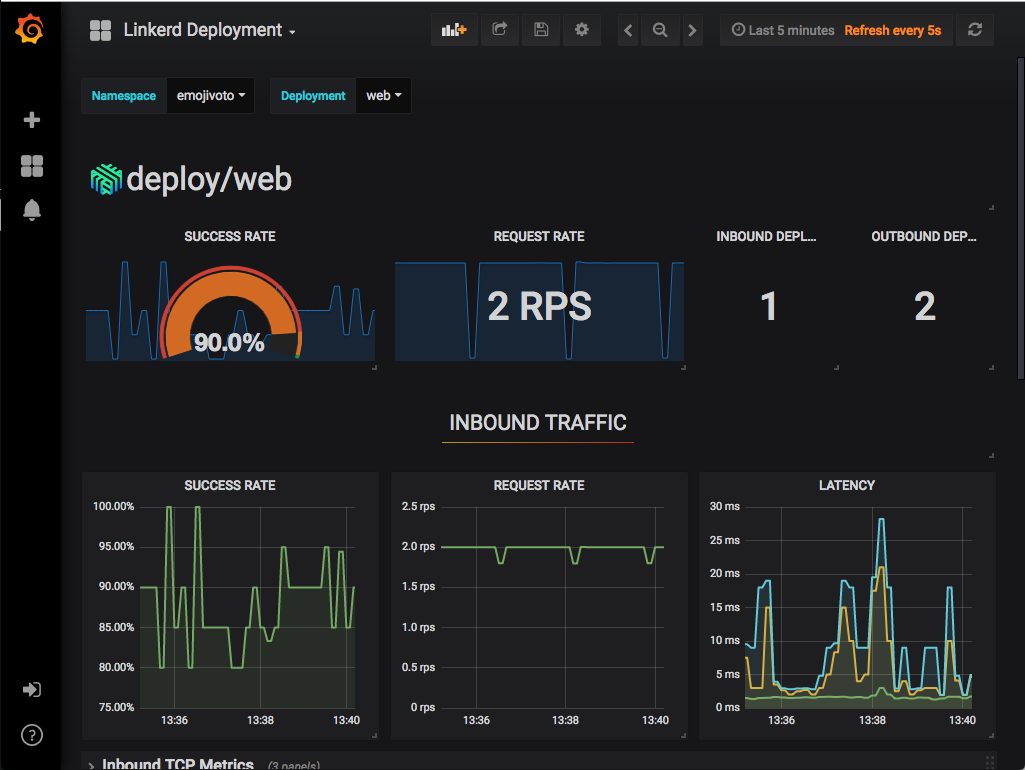
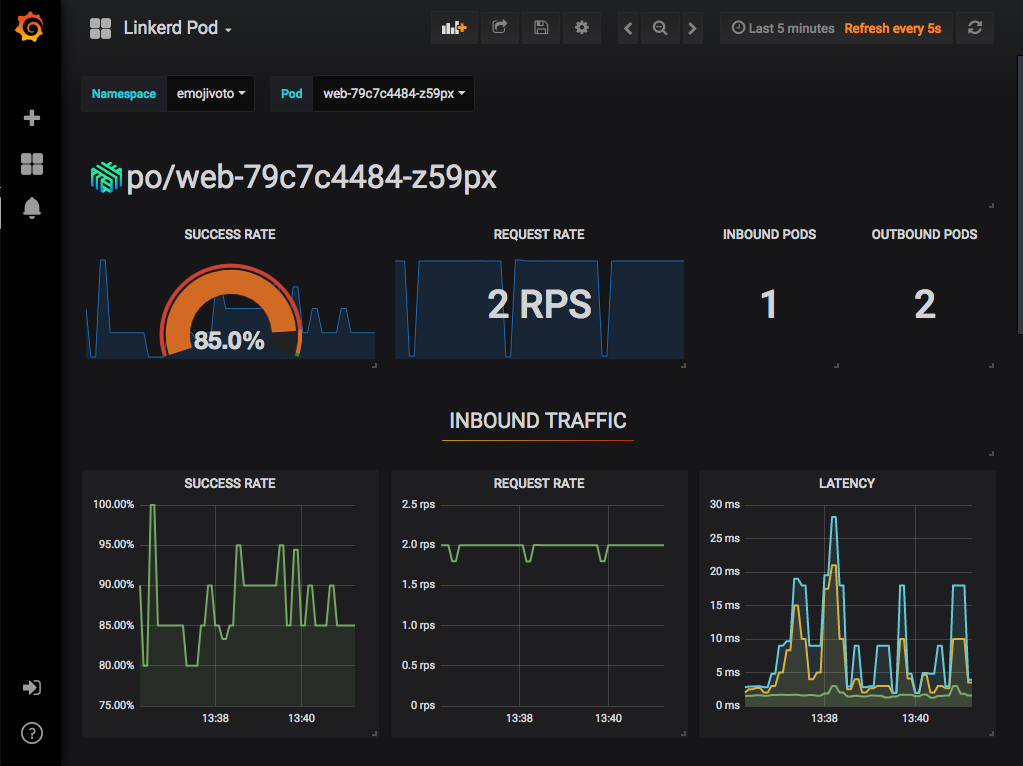
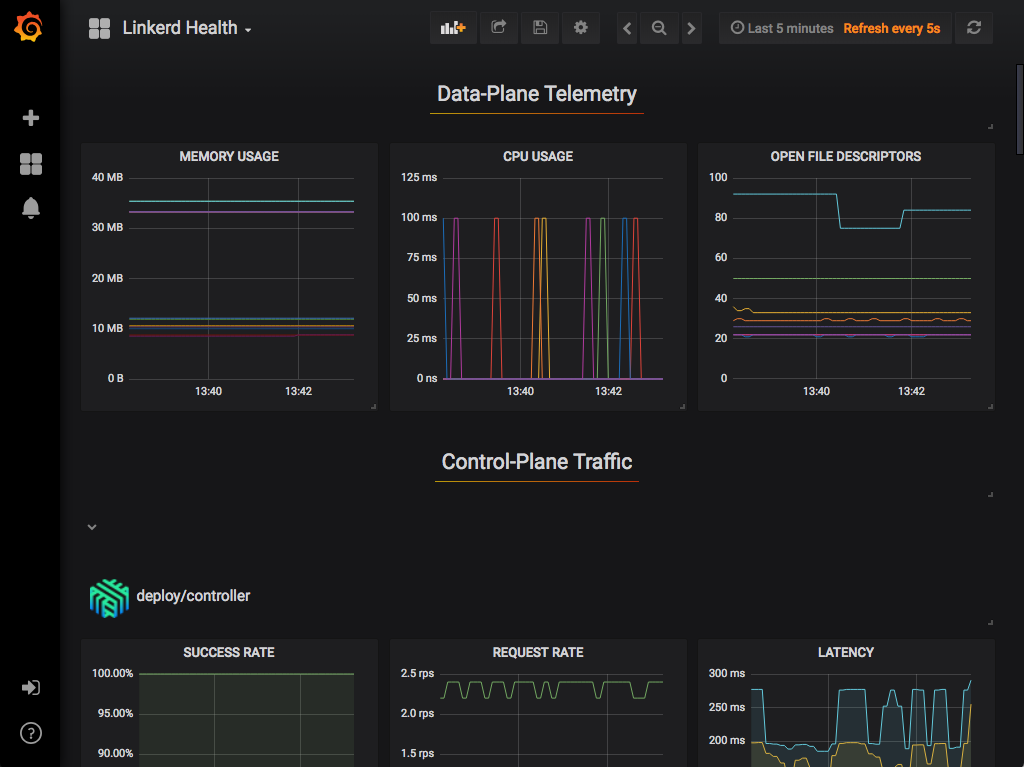
Grafana
Linkerd comes with many dashboards out of the box. The Grafana component is used to render and display these dashboards. You can reach these dashboards via links in the Linkerd dashboard itself. It is possible to see high level metrics and dig down into the details for your workloads as well as Linkerd itself.
The dashboards that are provided out of the box include:
Prometheus
Prometheus is a cloud native monitoring solution that is used to collect and store all of the Linkerd metrics. It is installed as part of the control plane and provides the data used by the CLI, dashboard and Grafana.
The proxy exposes a /metrics endpoint for Prometheus to scrape on port 4191.
This is scraped every 10 seconds. These metrics are then available to all the
other Linkerd components, such as the CLI and dashboard.

Data Plane
The Linkerd data plane is comprised of lightweight proxies, which are deployed
as sidecar containers alongside each instance of your service code. In order to
“add” a service to the Linkerd service mesh, the pods for that service must be
redeployed to include a data plane proxy in each pod. The proxy injector
accomplishes this by watching for a specific annotation that can either be added
with linkerd inject or by hand to the pod’s spec. You can add your
service to the data plane with a single CLI
command.
These proxies transparently intercept communication to and from each pod by utilizing iptables rules that are automatically configured by linkerd-init, and add features such as instrumentation and encryption (TLS), as well as allowing and denying requests according to the relevant policy.
These proxies are not designed to be configured by hand. Rather, their behavior is driven by the control plane.
Proxy
An ultralight transparent proxy written in Rust,
the proxy is installed into each pod of a service and becomes part of the data
plane. It receives all incoming traffic for a pod and intercepts all outgoing
traffic via an initContainer that configures iptables to forward the
traffic correctly. Because it is a sidecar and intercepts all the incoming and
outgoing traffic for a service, there are no code changes required and it can
even be added to a running service.
The proxy’s features include:
-
Transparent, zero-config proxying for HTTP, HTTP/2, and arbitrary TCP protocols.
-
Automatic Prometheus metrics export for HTTP and TCP traffic.
-
Transparent, zero-config WebSocket proxying.
-
Automatic, latency-aware, layer-7 load balancing.
-
Automatic layer-4 load balancing for non-HTTP traffic.
-
Automatic TLS.
-
An on-demand diagnostic tap API.
The proxy supports service discovery via DNS and the destination gRPC API.
Linkerd Init
To make the proxy truly transparent, traffic needs to be automatically routed
through it. The linkerd-init container is added as a Kubernetes
init container
that runs before any other containers are started. This executes a small
program which executes
iptables and configures the flow of traffic.
There are two main rules that iptables uses:
-
Any traffic being sent to the pod’s external IP address (10.0.0.1 for example) is forwarded to a specific port on the proxy (4143). By setting
SO_ORIGINAL_DSTon the socket, the proxy is able to forward the traffic to the original destination port that your application is listening on. -
Any traffic originating from within the pod and being sent to an external IP address (not 127.0.0.1) is forwarded to a specific port on the proxy (4140). Because
SO_ORIGINAL_DSTwas set on the socket, the proxy is able to forward the traffic to the original recipient (unless there is a reason to send it elsewhere). This does not result in a traffic loop because theiptablesrules explicitly skip the proxy’s UID.
CLI
The Linkerd CLI is run locally on your machine and is used to interact with the control and data planes. It can be used to view statistics, debug production issues in real time and install/upgrade the control and data planes.
Dashboard
The Linkerd dashboard provides a high level view of what is happening with your
services in real time. It can be used to view the “golden” metrics (success
rate, requests/second and latency), visualize service dependencies and
understand the health of specific service routes. One way to pull it up is by
running linkerd dashboard from the command line.
