Dashboard and Grafana
In addition to its command-line interface, Linkerd provides a web dashboard and pre-configured Grafana dashboards.
Linkerd Dashboard
The Linkerd dashboard provides a high level view of what is happening with your
services in real time. It can be used to view the “golden” metrics (success
rate, requests/second and latency), visualize service dependencies and
understand the health of specific service routes. One way to pull it up is by
running linkerd dashboard from the command line.

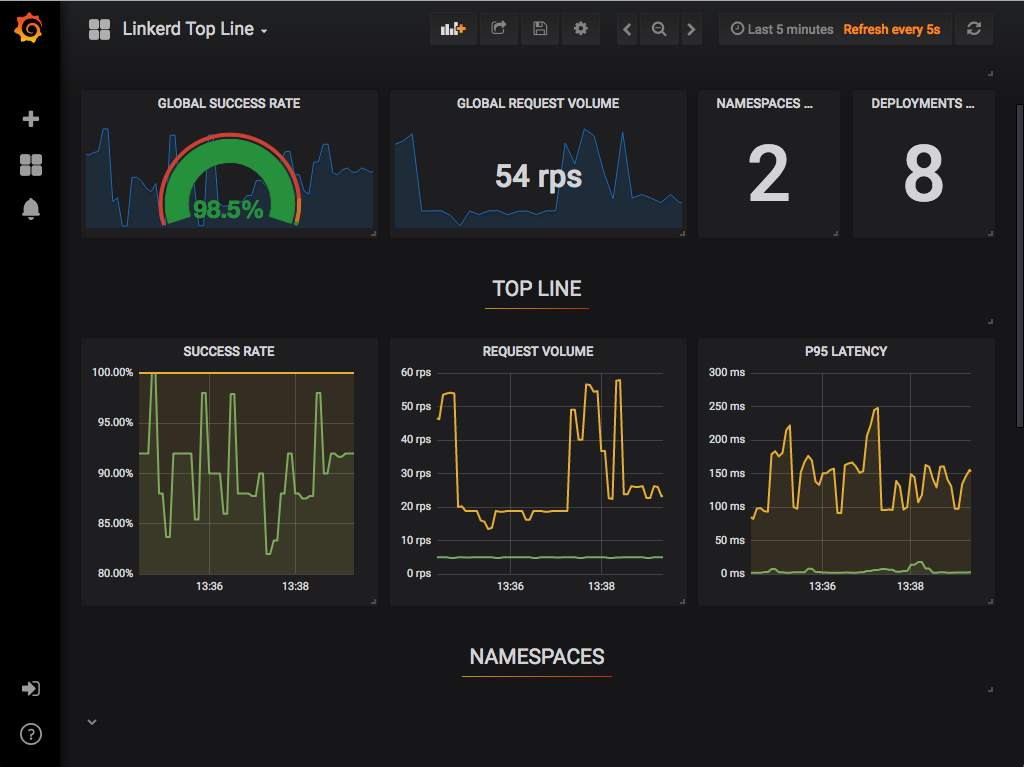
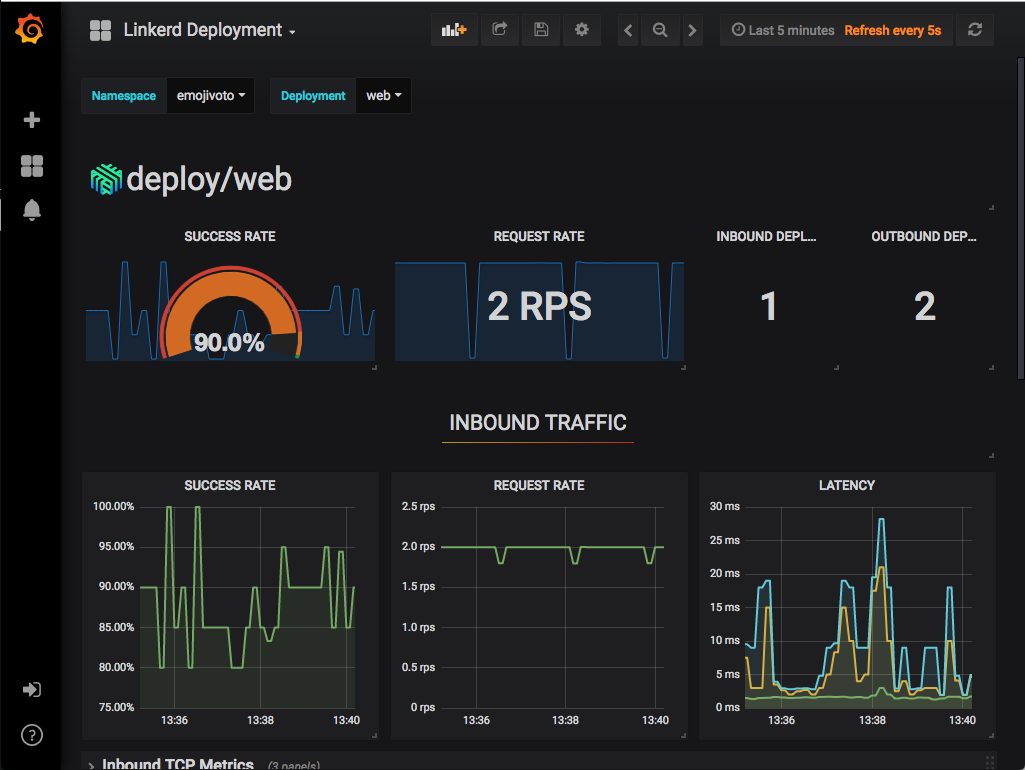
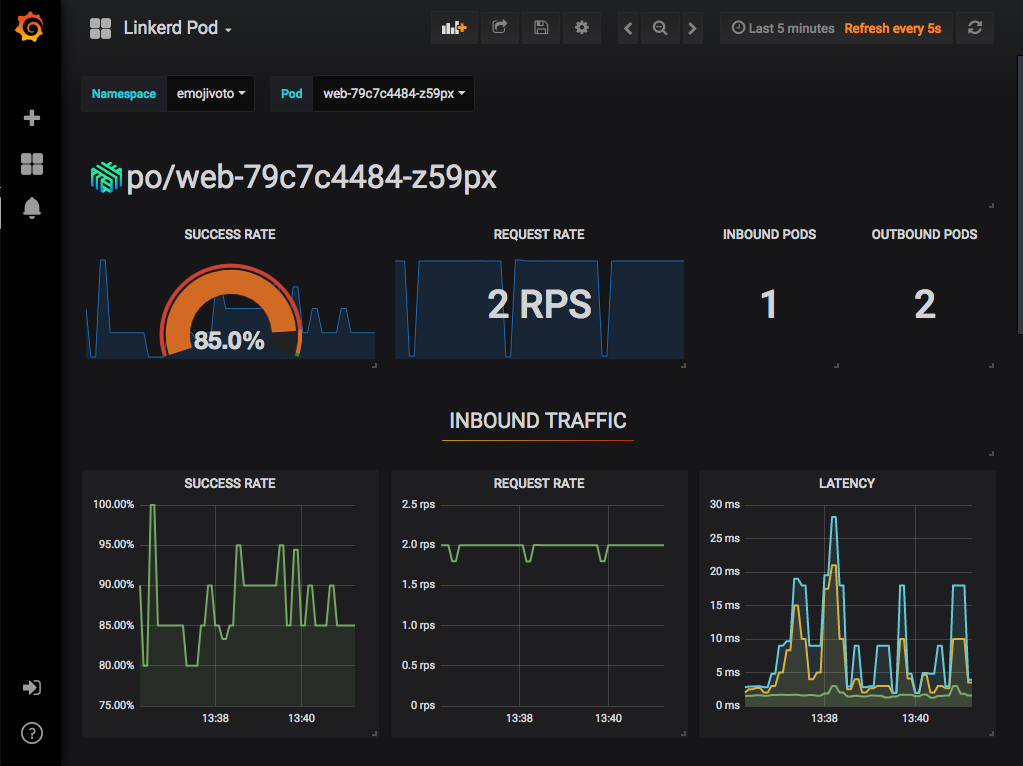
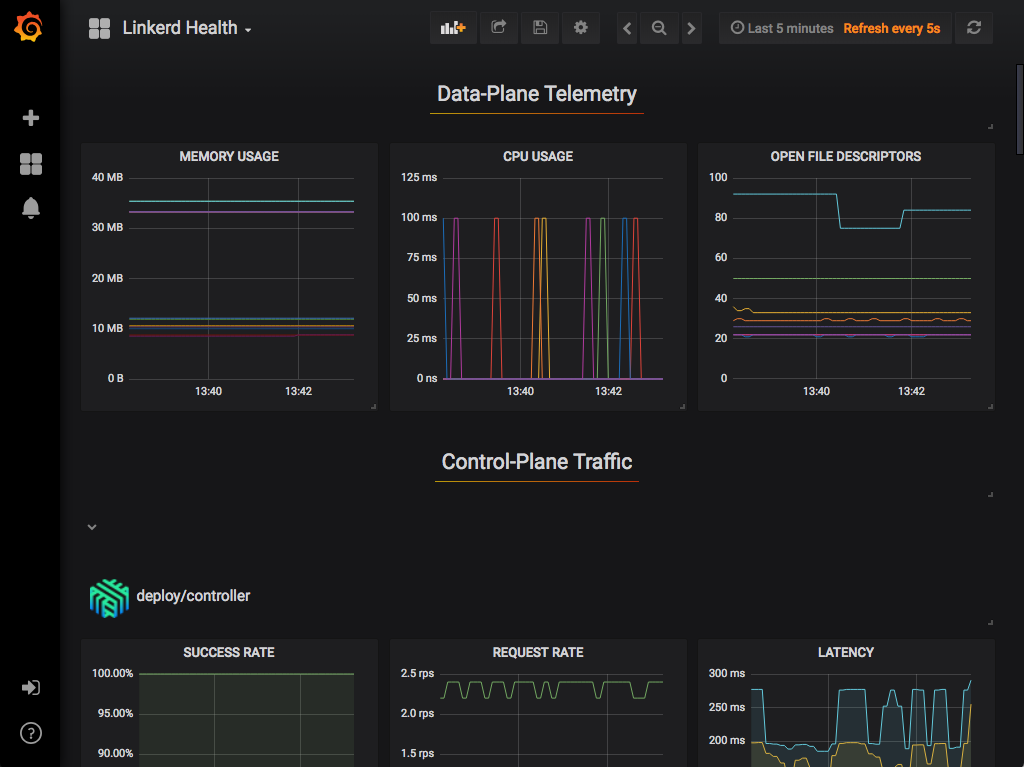
Grafana
As a component of the control plane, Grafana provides actionable dashboards for your services out of the box. It is possible to see high level metrics and dig down into the details, even for pods.
The dashboards that are provided out of the box include: