

I. Top-line service metrics
This tutorial focuses on visibility. You will learn how to use Linkerd to capture and report top-level service metrics such as success rates, request volumes, and latencies without requiring changes to application code.
Using Linkerd for service monitoring in Kubernetes
One of the advantages of operating at the request layer is that the service mesh has access to protocol-level semantics of success and failure. For example, if you’re running an HTTP service, Linkerd can understand the semantics of 200 versus 400 versus 500 responses and can calculate metrics like success rate automatically. (Operating at this layer becomes doubly important when we talk about retries—more on that in later articles.)
Let’s walk through a quick example of how to install Linkerd on Kubernetes to automatically capture aggregated, top-line service success rates without requiring application changes.
Step 0: Setup and Prerequisites
First, you’ll need a Kubernetes cluster and a functioning kubectl command on
your local machine. These following examples will assume you’re using either
GKE
or Minikube,
slight modifications may be needed for other environments—see our
Flavors of Kubernetes
help page for other environments.
If you’re running your clusters on GKE with Kubernetes v.1.6 or later, you’ll have to follow these additional steps:
You can check what Kubernetes version you are running with:
kubectl version --short
Note that the $USER environment variable should be the username of your Google Cloud account.
kubectl create clusterrolebinding cluster-admin-binding-$USER --clusterrole=cluster-admin
--user=$(gcloud config get-value account)

kubectl apply -f https://raw.githubusercontent.com/linkerd/linkerd-examples/master/k8s-daemonset/k8s/linkerd-rbac.yml
Your cluster should have at least 4 CPU’s available for this tutorial to work.
Step 1: Install Linkerd
Install Linkerd using this Kubernetes config. This will install Linkerd as a DaemonSet (i.e., one instance per host) running in the default Kubernetes namespace:
kubectl apply -f https://raw.githubusercontent.com/linkerd/linkerd-examples/master/k8s-daemonset/k8s/linkerd.yml
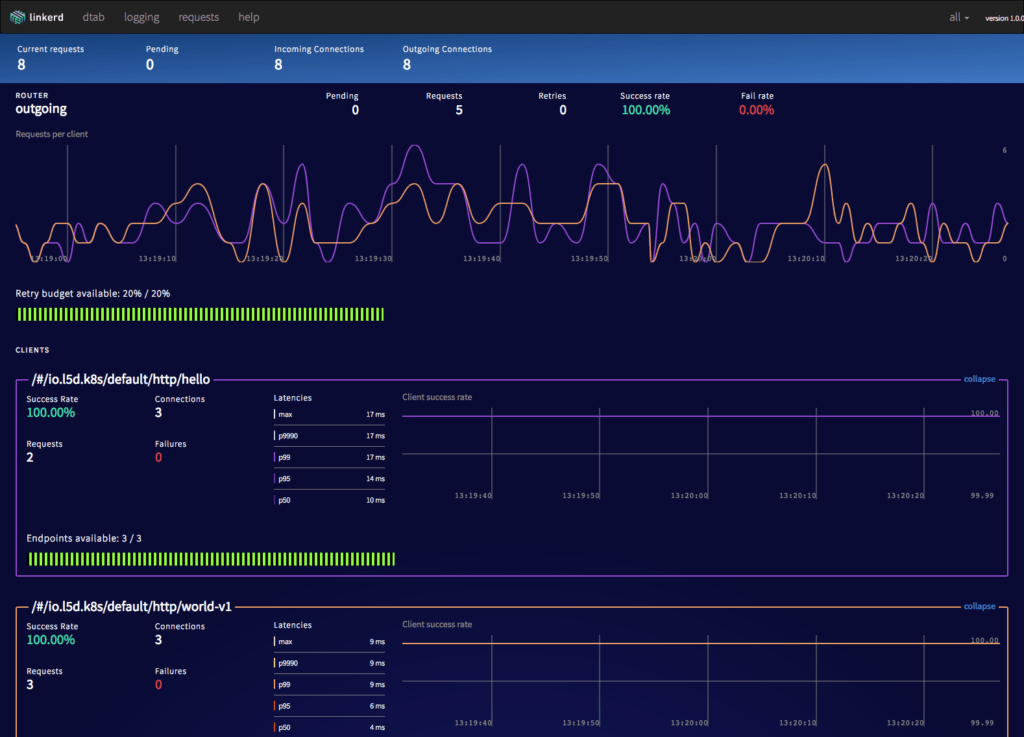
You can confirm that installation was successful by viewing Linkerd’s admin page:
Minikube
HOST_IP=$(kubectl get po -l app=l5d -o jsonpath="{.items[0].status.hostIP}")
NODE_PORT_ADMIN=$(kubectl get svc l5d -o 'jsonpath={.spec.ports[2].nodePort}')
open http://$HOST_IP:$NODE_PORT_ADMIN # on OS X
GKE
INGRESS_LB=$(kubectl get svc l5d -o jsonpath="{.status.loadBalancer.ingress[0].*}")
open http://$INGRESS_LB:9990 # on OS X
Step 2: Install the sample apps
Install two services, “hello” and “world”, in the default namespace.
Minikube
kubectl apply -f https://raw.githubusercontent.com/linkerd/linkerd-examples/master/k8s-daemonset/k8s/hello-world-legacy.yml
GKE
kubectl apply -f https://raw.githubusercontent.com/linkerd/linkerd-examples/master/k8s-daemonset/k8s/hello-world.yml
These two services–“hello” and “world”–function together to make a highly scalable, “hello world” microservice (where the hello service, naturally, calls the world service to complete its request).
You can see this in action by sending traffic through Linkerd’s external IP:
Minikube
NODE_PORT=$(kubectl get svc l5d -o 'jsonpath={.spec.ports[0].nodePort}')
http_proxy=$HOST_IP:$NODE_PORT curl -s http://hello
GKE
http_proxy=$INGRESS_LB:4140 curl -s http://hello
You should see the string “Hello world”.
Step 3: Install Linkerd-Viz
Finally, let’s take a look at what our services are doing by installing Linkerd-viz. Linkerd-viz is a supplemental package that includes a simple Prometheus and Grafana setup and is configured to automatically find Linkerd instances.
Install Linkerd-viz using this Linkerd-viz config.
This will install Linkerd-viz into the default namespace:
kubectl apply -f https://raw.githubusercontent.com/linkerd/linkerd-viz/main/k8s/linkerd-viz.yml
Open Linkerd-viz’s external IP to view the dashboard:
Minikube
VIZ_HOST_IP=$(kubectl get po -l name=linkerd-viz -o jsonpath="{.items[0].status.hostIP}")
VIZ_NODE_PORT=$(kubectl get svc linkerd-viz -o 'jsonpath={.spec.ports[0].nodePort}')
open http://$VIZ_HOST_IP:$VIZ_NODE_PORT # on OS X
GKE
VIZ_INGRESS_LB=$(kubectl get svc linkerd-viz -o jsonpath="{.status.loadBalancer.ingress[0].*}")
open http://$VIZ_INGRESS_LB # on OS X
You should see a dashboard, including selectors by service and instance. All charts respond to these service and instance selectors:

The Linkerd-viz dashboard includes three sections:
- TOP LINE: Cluster-wide success rate and request volume.
- SERVICE METRICS: One section for each application deployed. Includes success rate, request volume, and latency.
- PER-INSTANCE METRICS: Success rate, request volume, and latency for each node in your cluster.
That’s all
With just three simple commands we were able to install Linkerd on our Kubernetes cluster, install an app, and use Linkerd to gain visibility into the health of the app’s services. Of course, Linkerd is providing much more than visibility: under the hood, we’ve enabled latency-aware load balancing, automatic retries and circuit breaking, distributed tracing, and more.
For help with this or anything else about Linkerd, feel free to stop by our Linkerd community Slack, or post a topic on Linkerd discourse!