


Distributed tracing with Linkerd
Using distributed tracing in practice can be complex, for a high level explanation of what you get and how it is done, we’ve assembled a list of myths.
This guide will walk you through configuring and enabling tracing for emojivoto. Jump to the end for some recommendations on the best way to make use of distributed tracing with Linkerd.
To use distributed tracing, you’ll need to:
- Install the Linkerd-Jaeger extension.
- Modify your application to emit spans.
In the case of emojivoto, once all these steps are complete there will be a topology that looks like:

Prerequisites
- To use this guide, you’ll need to have Linkerd installed on your cluster. Follow the Installing Linkerd Guide if you haven’t already done this.
Install the Linkerd-Jaeger extension
The first step of getting distributed tracing setup is installing the Linkerd-Jaeger extension onto your cluster. This extension consists of a collector, a Jaeger backend, and a Jaeger-injector. The collector consumes spans emitted from the mesh and your applications and sends them to the Jaeger backend which stores them and serves a dashboard to view them. The Jaeger-injector is responsible for configuring the Linkerd proxies to emit spans.
To install the Linkerd-Jaeger extension, run the command:
linkerd jaeger install | kubectl apply -f -
You can verify that the Linkerd-Jaeger extension was installed correctly by running:
linkerd jaeger check
Install Emojivoto
Add emojivoto to your cluster and inject it with the Linkerd proxy:
linkerd inject https://run.linkerd.io/emojivoto.yml | kubectl apply -f -
Before moving onto the next step, make sure everything is up and running with
kubectl:
kubectl -n emojivoto rollout status deploy/web
Modify the application
Unlike most features of a service mesh, distributed tracing requires modifying the source of your application. Tracing needs some way to tie incoming requests to your application together with outgoing requests to dependent services. To do this, some headers are added to each request that contain a unique ID for the trace. Linkerd uses the b3 propagation format to tie these things together.
We’ve already modified emojivoto to instrument its requests with this information, this commit shows how this was done. For most programming languages, it simply requires the addition of a client library to take care of this. Emojivoto uses the OpenCensus client, but others can be used.
To enable tracing in emojivoto, run:
kubectl -n emojivoto set env --all deploy OC_AGENT_HOST=collector.linkerd-jaeger:55678
This command will add an environment variable that enables the applications to propagate context and emit spans.
Explore Jaeger
With vote-bot starting traces for every request, spans should now be showing
up in Jaeger. To get to the UI, run:
linkerd jaeger dashboard

You can search for any service in the dropdown and click Find Traces. vote-bot
is a great way to get started.
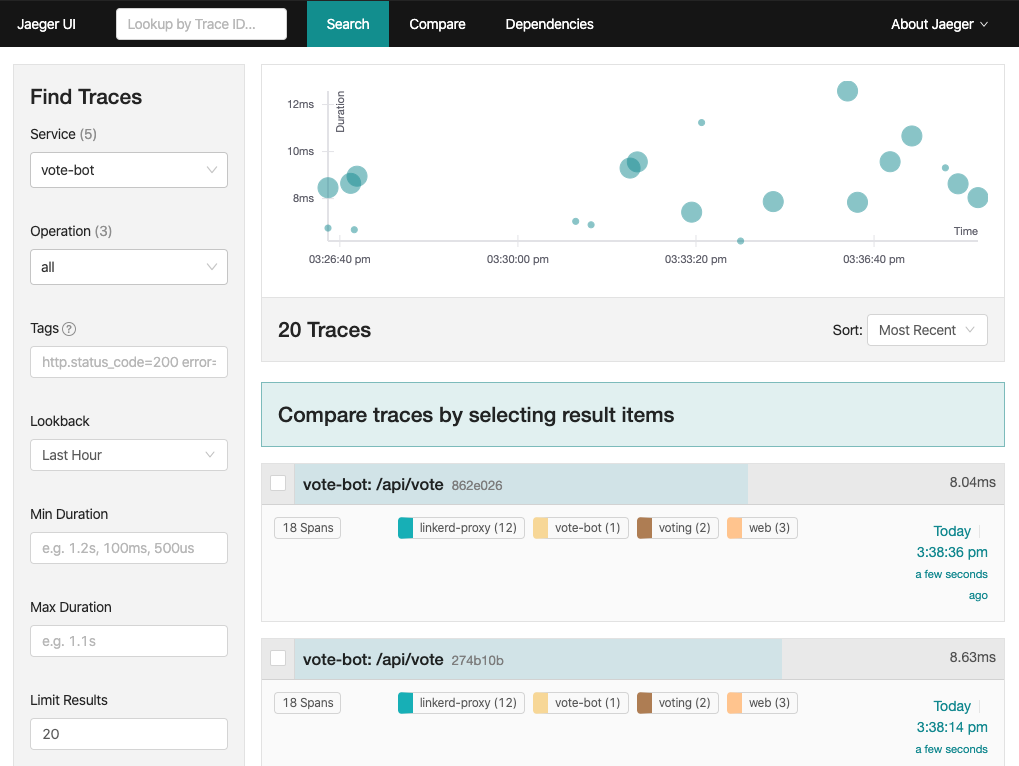
Clicking on a specific trace will provide all the details, you’ll be able to see the spans for every proxy!

There sure are a lot of linkerd-proxy spans in that output. Internally, the
proxy has a server and client side. When a request goes through the proxy, it is
received by the server and then issued by the client. For a single request that
goes between two meshed pods, there will be a total of 4 spans. Two will be on
the source side as the request traverses that proxy and two will be on the
destination side as the request is received by the remote proxy.
Integration with the Dashboard
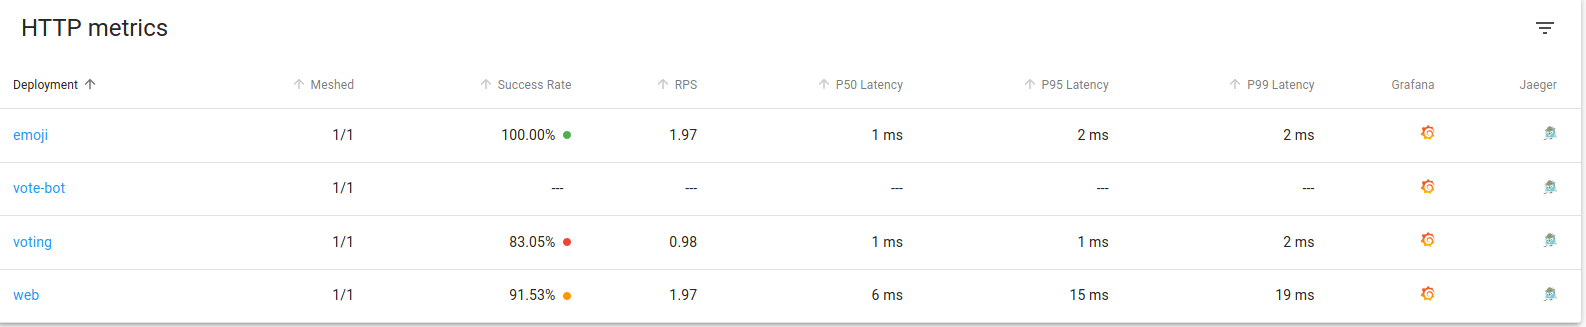
After having set up the Linkerd-Jaeger extension, as the proxy adds application meta-data as trace attributes, users can directly jump into related resources traces directly from the linkerd-web dashboard by clicking the Jaeger icon in the Metrics Table, as shown below:
To obtain that functionality you need to install (or upgrade) the Linkerd-Viz extension specifying the service exposing the Jaeger UI. By default, this would be something like this:
linkerd viz install --set jaegerUrl=jaeger.linkerd-jaeger:16686 \
  | kubectl apply -f -
Cleanup
To cleanup, uninstall the Linkerd-Jaeger extension along with emojivoto by running:
linkerd jaeger uninstall | kubectl delete -f -
kubectl delete ns emojivoto
Bring your own Jaeger
If you have an existing Jaeger installation, you can configure the OpenCensus collector to send traces to it instead of the Jaeger instance built into the Linkerd-Jaeger extension.
Create the following YAML file which disables the built in Jaeger instance and specifies the OpenCensus collector’s config.
cat <<EOF > jaeger-linkerd.yaml
jaeger:
  enabled: false
collector:
  config:
    receivers:
      otlp:
        protocols:
          grpc:
          http:
      opencensus:
      zipkin:
      jaeger:
        protocols:
          grpc:
          thrift_http:
          thrift_compact:
          thrift_binary:
    processors:
      batch:
    extensions:
      health_check:
    exporters:
      jaeger:
        endpoint: my-jaeger-collector.my-jaeger-ns:14250
        tls:
          insecure: true
    service:
      extensions: [health_check]
      pipelines:
        traces:
          receivers: [otlp,opencensus,zipkin,jaeger]
          processors: [batch]
          exporters: [jaeger]
EOF
linkerd jaeger install --values ./jaeger-linkerd.yaml | kubectl apply -f -
You’ll want to ensure that the exporters.jaeger.endpoint which is
my-jaeger-collector.my-jaeger-ns:14250 in this example is set to a value
appropriate for your environment. This should point to a Jaeger Collector on
port 14250.
The YAML file is merged with the Helm values.yaml which shows other possible values that can be configured.
It is also possible to manually edit the OpenCensus configuration to have it export to any backend which it supports. See the OpenCensus documentation for a full list.
Troubleshooting
I don’t see any spans for the proxies
The Linkerd proxy uses the b3 propagation format. Some client libraries, such as Jaeger, use different formats by default. You’ll want to configure your client library to use the b3 format to have the proxies participate in traces.
Recommendations
Ingress
The ingress is an especially important component for distributed tracing because it typically creates the root span of each trace and is responsible for deciding if that trace should be sampled or not. Having the ingress make all sampling decisions ensures that either an entire trace is sampled or none of it is, and avoids creating “partial traces”.
Distributed tracing systems all rely on services to propagate metadata about the current trace from requests that they receive to requests that they send. This metadata, called the trace context, is usually encoded in one or more request headers. There are many different trace context header formats and while we hope that the ecosystem will eventually converge on open standards like W3C tracecontext, we only use the b3 format today. Being one of the earliest widely used formats, it has the widest support, especially among ingresses like Nginx.
This reference architecture uses a traffic generator called vote-bot instead
of an ingress to create the root span of each trace.
Client Library
While it is possible for services to manually propagate trace propagation headers, it’s usually much easier to use a library which does three things:
- Propagates the trace context from incoming request headers to outgoing request headers
- Modifies the trace context (i.e. starts a new span)
- Transmits this data to a trace collector
We recommend using OpenCensus in your service and configuring it with:
- b3 propagation (this is the default)
- the OpenCensus agent exporter
The OpenCensus agent exporter will export trace data to the OpenCensus collector over a gRPC API. The details of how to configure OpenCensus will vary language by language, but there are guides for many popular languages. You can also see an end-to-end example of this in Go with our example application, Emojivoto.
You may notice that the OpenCensus project is in maintenance mode and will become part of OpenTelemetry. Unfortunately, OpenTelemetry is not yet production ready and so OpenCensus remains our recommendation for the moment.
It is possible to use many other tracing client libraries as well. Just make sure the b3 propagation format is being used and the client library can export its spans in a format the collector has been configured to receive.
Collector: OpenCensus
The OpenCensus collector receives trace data from the OpenCensus agent exporter and potentially does translation and filtering before sending that data to Jaeger. Having the OpenCensus exporter send to the OpenCensus collector gives us a lot of flexibility: we can switch to any backend that OpenCensus supports without needing to interrupt the application.
Backend: Jaeger
Jaeger is one of the most widely used tracing backends and for good reason: it is easy to use and does a great job of visualizing traces. However, any backend supported by OpenCensus can be used instead.
Linkerd
If your application is injected with Linkerd, the Linkerd proxy will participate in the traces and will also emit trace data to the OpenCensus collector. This enriches the trace data and allows you to see exactly how much time requests are spending in the proxy and on the wire.
While Linkerd can only actively participate in traces that use the b3 propagation format, Linkerd will always forward unknown request headers transparently, which means it will never interfere with traces that use other propagation formats.
