


Distributed Tracing
Tracing can be an invaluable tool in debugging distributed systems performance, especially for identifying bottlenecks and understanding the latency cost of each component in your system. Linkerd can be configured to emit trace spans from the proxies, allowing you to see exactly what time requests and responses spend inside.
Unlike most of the features of Linkerd, distributed tracing requires both code changes and configuration. (You can read up on Distributed tracing in the service mesh: four myths for why this is.)
Furthermore, Linkerd provides many of the features that are often associated with distributed tracing, without requiring configuration or application changes, including:
- Live service topology and dependency graphs
- Aggregated service health, latencies, and request volumes
- Aggregated path / route health, latencies, and request volumes
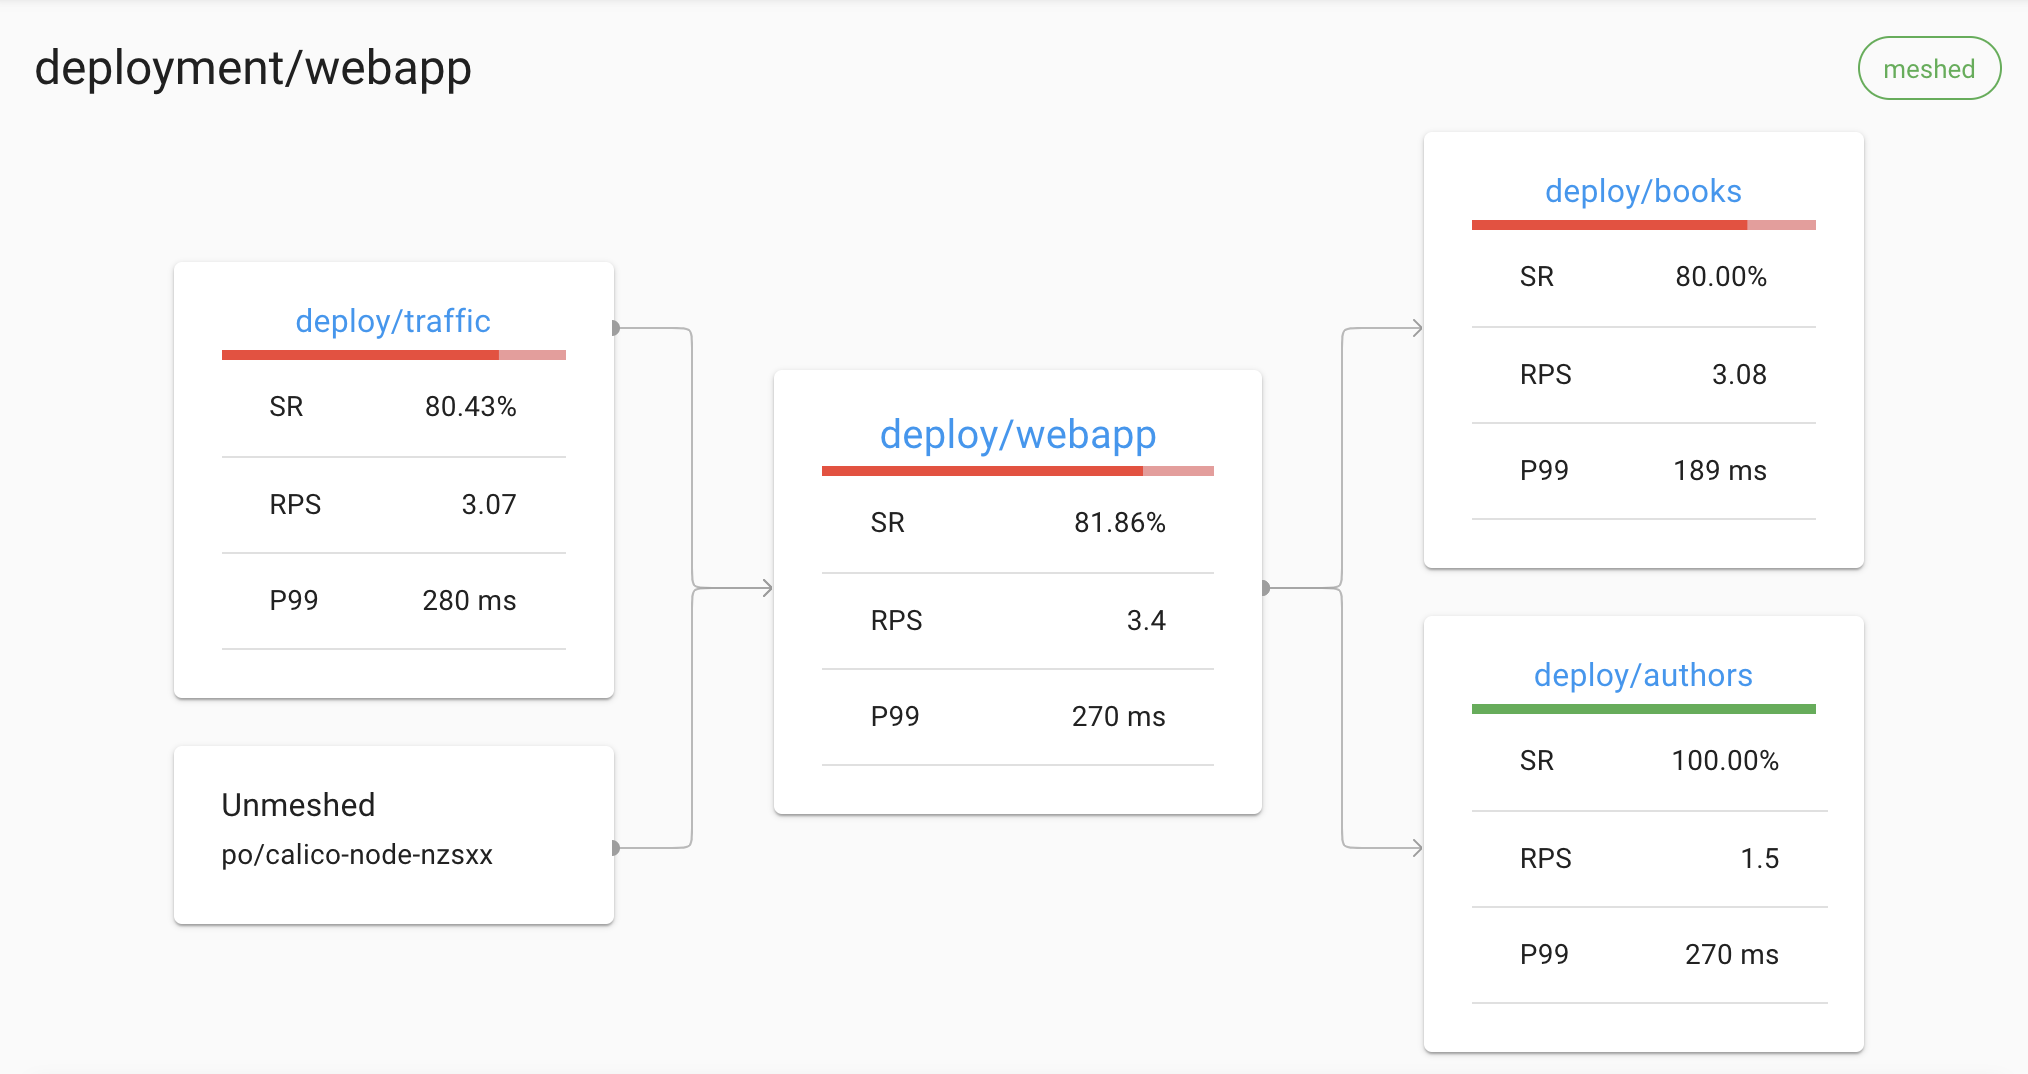
For example, Linkerd can display a live topology of all incoming and outgoing dependencies for a service, without requiring distributed tracing or any other such application modification:
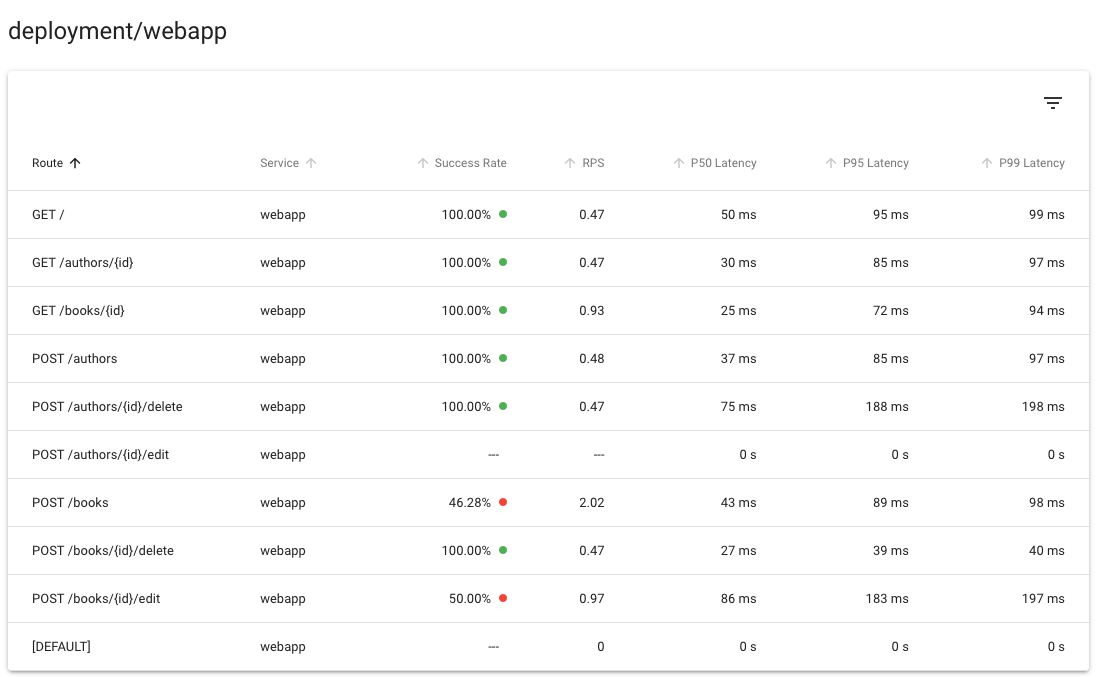
Likewise, Linkerd can provide golden metrics per service and per route, again without requiring distributed tracing or any other such application modification:
Using distributed tracing
That said, distributed tracing certainly has its uses, and Linkerd makes this as easy as it can. Linkerd’s role in distributed tracing is actually quite simple: when a Linkerd data plane proxy sees a tracing header in a proxied HTTP request, Linkerd will emit a trace span for that request. This span will include information about the exact amount of time spent in the Linkerd proxy. When paired with software to collect, store, and analyze this information, this can provide significant insight into the behavior of the mesh.
To use this feature, you’ll also need to introduce several additional components in your system., including an ingress layer that kicks off the trace on particular requests, a client library for your application (or a mechanism to propagate trace headers), a trace collector to collect span data and turn them into traces, and a trace backend to store the trace data and allow the user to view/query it.
For details, please see our guide to adding distributed tracing to your application with Linkerd.
