Debugging gRPC applications with request tracing
The demo application emojivoto has some issues. Let’s use that and Linkerd to diagnose an application that fails in ways which are a little more subtle than the entire service crashing. This guide assumes that you’ve followed the steps in the Getting Started guide and have Linkerd and the demo application running in a Kubernetes cluster. If you’ve not done that yet, go get started and come back when you’re done!
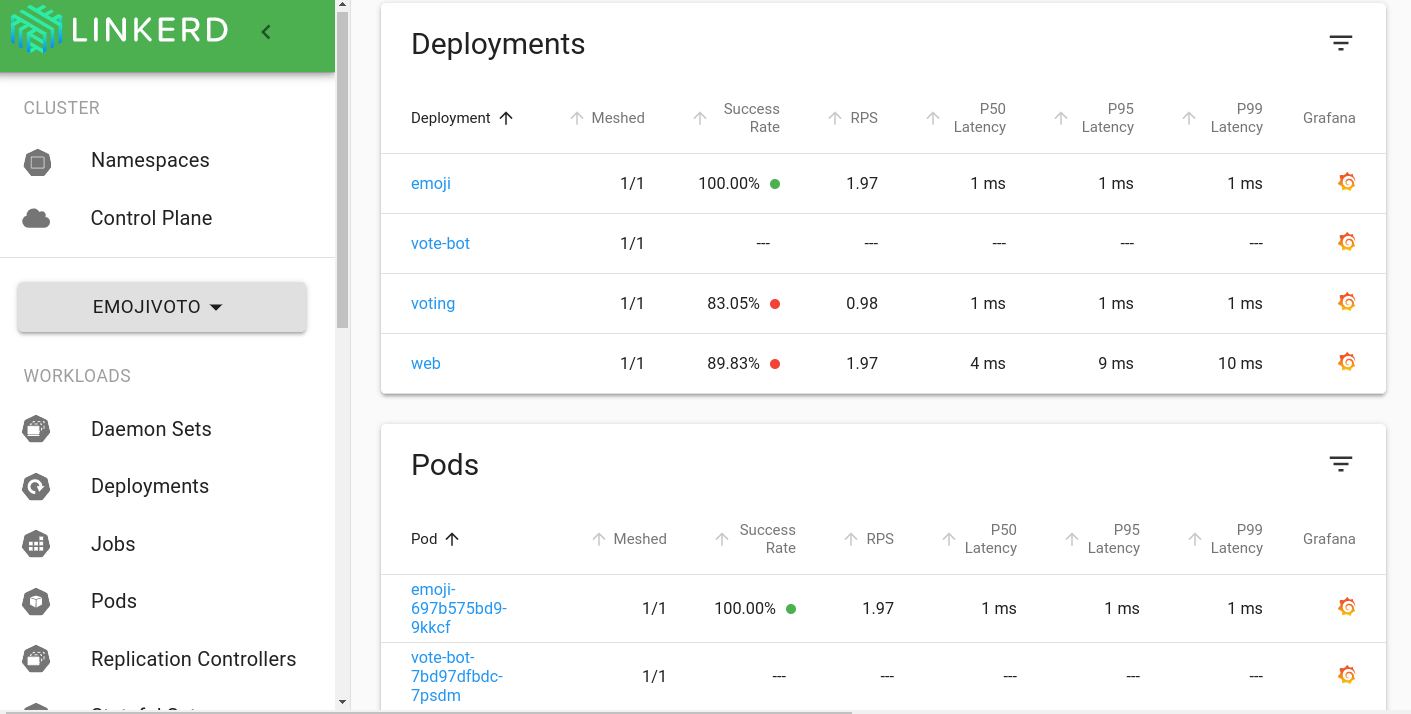
If you glance at the Linkerd dashboard (by running the linkerd viz dashboard
command), you should see all the resources in the emojivoto namespace,
including the deployments. Each deployment running Linkerd shows success rate,
requests per second and latency percentiles.

That’s pretty neat, but the first thing you might notice is that the success
rate is well below 100%! Click on web and let’s dig in.

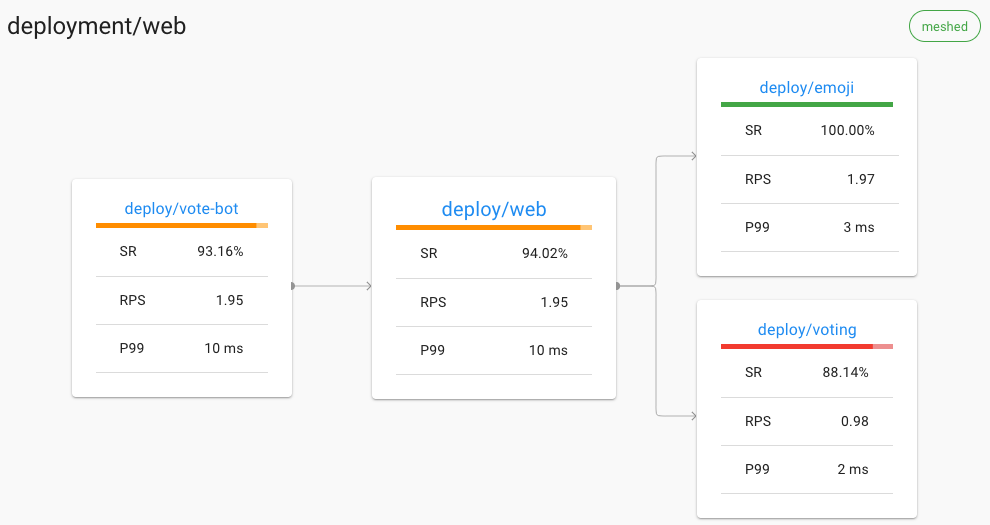
You should now be looking at the Deployment page for the web deployment. The
first thing you’ll see here is that the web deployment is taking traffic from
vote-bot (a deployment included with emojivoto to continually generate a low
level of live traffic). The web deployment also has two outgoing dependencies,
emoji and voting.
While the emoji deployment is handling every request from web successfully, it looks like the voting deployment is failing some requests! A failure in a dependent deployment may be exactly what is causing the errors that web is returning.
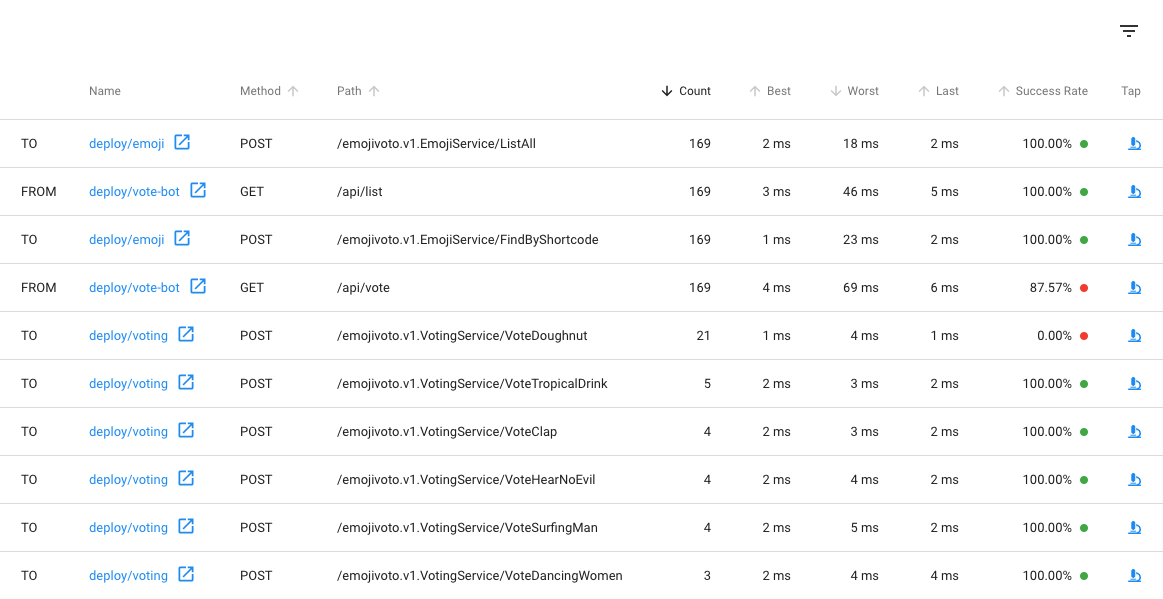
Let’s scroll a little further down the page, we’ll see a live list of all
traffic that is incoming to and outgoing from web. This is interesting:

There are two calls that are not at 100%: the first is vote-bot’s call to the
/api/vote endpoint. The second is the VoteDoughnut call from the web
deployment to its dependent deployment, voting. Very interesting! Since
/api/vote is an incoming call, and VoteDoughnut is an outgoing call, this is
a good clue that this endpoint is what’s causing the problem!
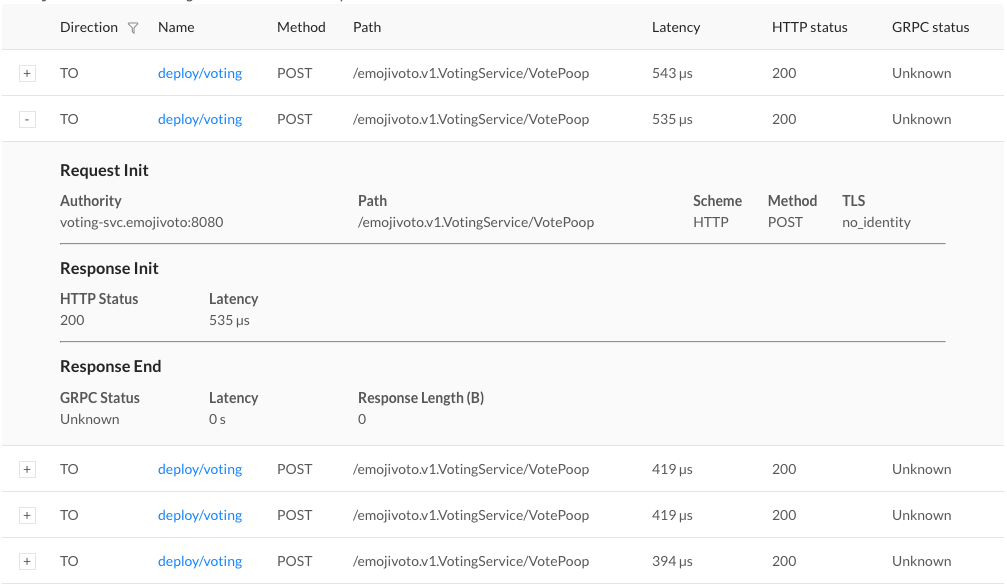
Finally, to dig a little deeper, we can click on the tap icon in the far right
column. This will take us to the live list of requests that match only this
endpoint. You’ll see Unknown under the GRPC status column. This is because
the requests are failing with a
gRPC status code 2, which
is a common error response as you can see from the code. Linkerd is
aware of gRPC’s response classification without any other configuration!

At this point, we have everything required to get the endpoint fixed and restore the overall health of our applications.


