Debugging HTTP applications with per-route metrics
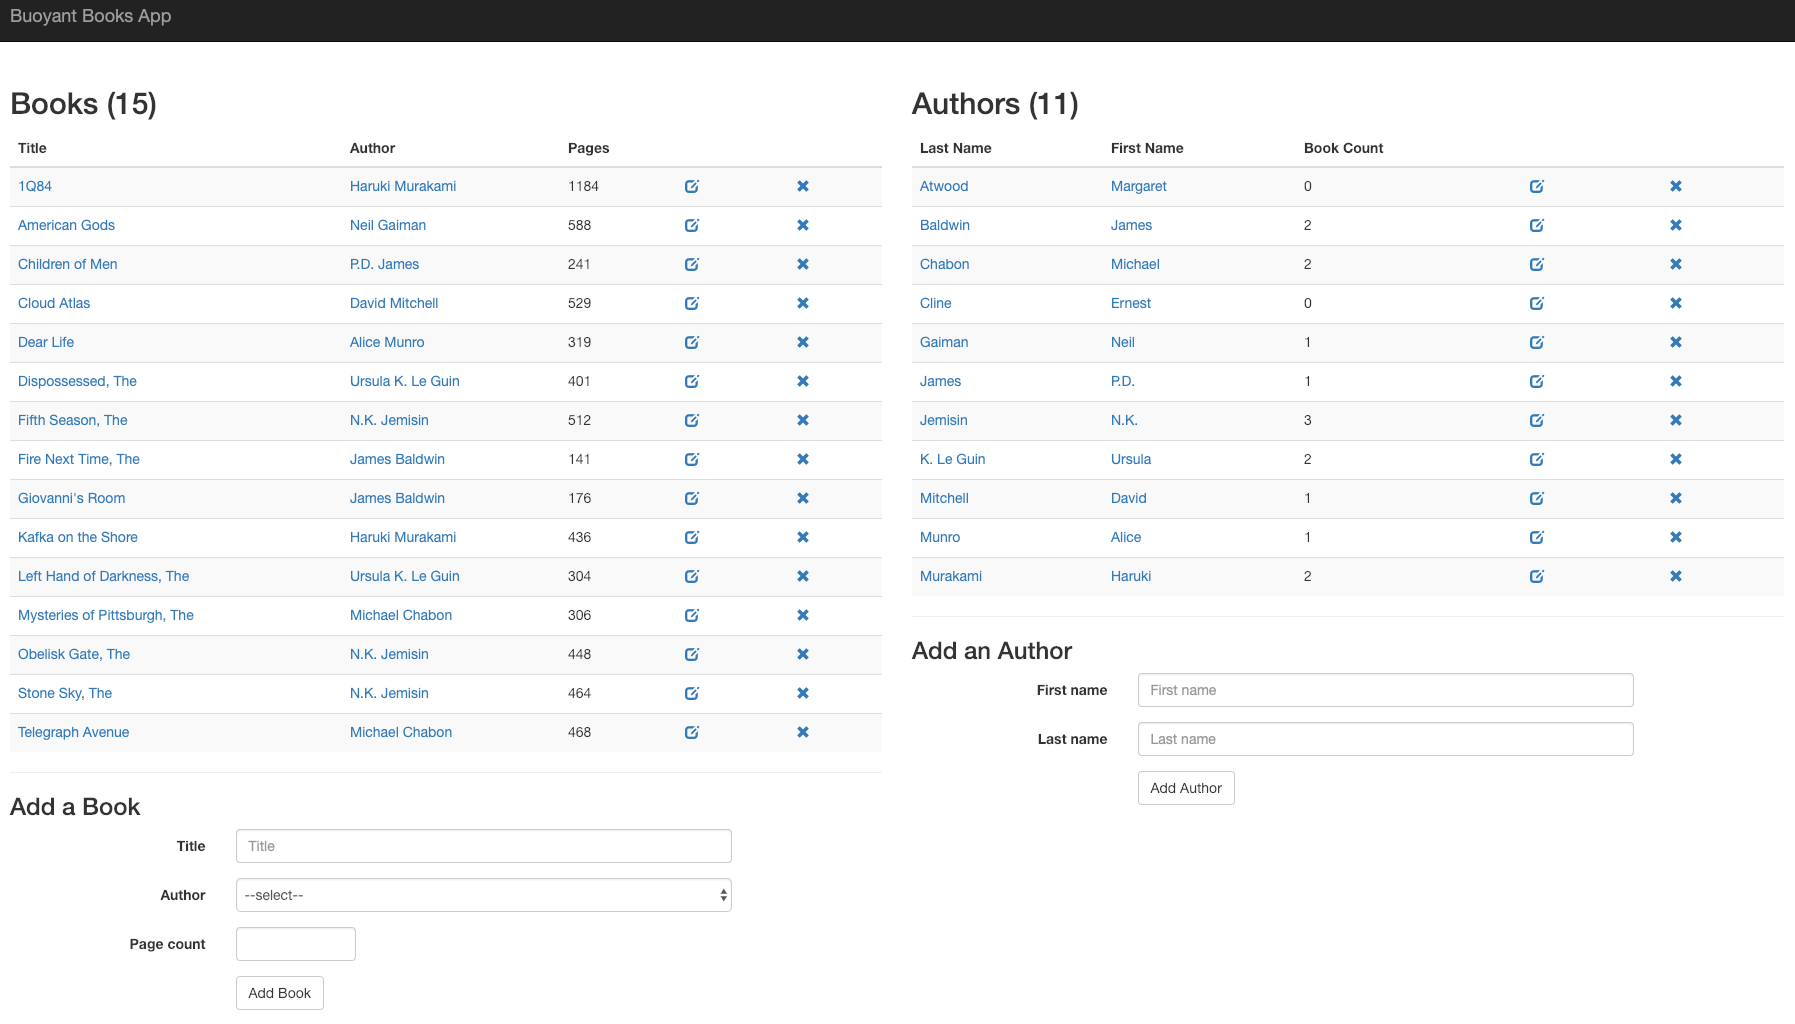
This demo is of a Ruby application that helps you manage your bookshelf. It consists of multiple microservices and uses JSON over HTTP to communicate with the other services. There are three services:
webapp: the frontend
authors: an API to manage the authors in the system
books: an API to manage the books in the system
For demo purposes, the app comes with a simple traffic generator. The overall topology looks like this:

Prerequisites
To use this guide, you’ll need to have Linkerd installed on your cluster. Follow the Installing Linkerd Guide if you haven’t already done this.
Install the app
To get started, let’s install the books app onto your cluster. In your local terminal, run:
kubectl create ns booksapp && \
  curl --proto '=https' --tlsv1.2 -sSfL https://run.linkerd.io/booksapp.yml \
  | kubectl -n booksapp apply -f -
This command creates a namespace for the demo, downloads its Kubernetes resource
manifest and uses kubectl to apply it to your cluster. The app comprises the
Kubernetes deployments and services that run in the booksapp namespace.
Downloading a bunch of containers for the first time takes a little while. Kubernetes can tell you when all the services are running and ready for traffic. Wait for that to happen by running:
kubectl -n booksapp rollout status deploy webapp
You can also take a quick look at all the components that were added to your cluster by running:
kubectl -n booksapp get all
Once the rollout has completed successfully, you can access the app itself by
port-forwarding webapp locally:
kubectl -n booksapp port-forward svc/webapp 7000 >/dev/null &
(We redirect to /dev/null just so you don’t get flooded with “Handling
connection” messages for the rest of the exercise.)
Open http://localhost:7000/ in your browser to see the frontend.

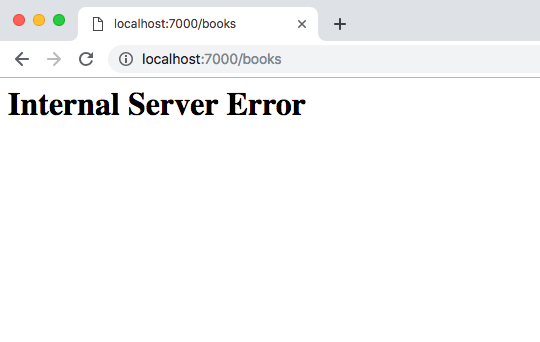
Unfortunately, there is an error in the app: if you click Add Book, it will fail 50% of the time. This is a classic case of non-obvious, intermittent failure—the type that drives service owners mad because it is so difficult to debug. Kubernetes itself cannot detect or surface this error. From Kubernetes’s perspective, it looks like everything’s fine, but you know the application is returning errors.

Add Linkerd to the service
Now we need to add the Linkerd data plane proxies to the service. The easiest option is to do something like this:
kubectl get -n booksapp deploy -o yaml \
  | linkerd inject - \
  | kubectl apply -f -
This command retrieves the manifest of all deployments in the booksapp
namespace, runs them through linkerd inject, and then re-applies with
kubectl apply. The linkerd inject command annotates each resource to specify
that they should have the Linkerd data plane proxies added, and Kubernetes does
this when the manifest is reapplied to the cluster. Best of all, since
Kubernetes does a rolling deploy, the application stays running the entire time.
(See Automatic Proxy Injection for more details
on how this works.)
Debugging
Let’s use Linkerd to discover the root cause of this app’s failures. Linkerd’s
proxy exposes rich metrics about the traffic that it processes, including HTTP
response codes. The metric that we’re interested is
outbound_http_route_backend_response_statuses_total and will help us identify
where HTTP errors are occuring. We can use the
linkerd diagnostics proxy-metrics command to get proxy metrics. Pick one of
your webapp pods and run the following command to get the metrics for HTTP 500
responses:
linkerd diagnostics proxy-metrics -n booksapp po/webapp-pod-here \
| grep outbound_http_route_backend_response_statuses_total \
| grep http_status=\"500\"
This should return a metric that looks something like:
outbound_http_route_backend_response_statuses_total{
  parent_group="core",
  parent_kind="Service",
  parent_namespace="booksapp",
  parent_name="books",
  parent_port="7002",
  parent_section_name="",
  route_group="",
  route_kind="default",
  route_namespace="",
  route_name="http",
  backend_group="core",
  backend_kind="Service",
  backend_namespace="booksapp",
  backend_name="books",
  backend_port="7002",
  backend_section_name="",
  http_status="500",
  error=""
} 207
This counter tells us that the webapp pod received a total of 207 HTTP 500
responses from the books Service on port 7002.
HTTPRoute
We know that the webapp component is getting 500s from the books component, but
it would be great to narrow this down further and get per route metrics. To do
this, we take advantage of the Gateway API and define a set of HTTPRoute
resources, each attached to the books Service by specifying it as their
parent_ref.
kubectl apply -f - <<EOF
kind: HTTPRoute
apiVersion: gateway.networking.k8s.io/v1beta1
metadata:
  name: books-list
  namespace: booksapp
spec:
  parentRefs:
    - name: books
      group: core
      kind: Service
      port: 7002
  rules:
    - matches:
        - path:
            type: Exact
            value: "/books.json"
---
kind: HTTPRoute
apiVersion: gateway.networking.k8s.io/v1beta1
metadata:
  name: books-create
  namespace: booksapp
spec:
  parentRefs:
    - name: books
      group: core
      kind: Service
      port: 7002
  rules:
    - matches:
        - path:
            type: Exact
            value: "/books.json"
          method: POST
---
kind: HTTPRoute
apiVersion: gateway.networking.k8s.io/v1beta1
metadata:
  name: books-delete
  namespace: booksapp
spec:
  parentRefs:
    - name: books
      group: core
      kind: Service
      port: 7002
  rules:
    - matches:
        - path:
            type: RegularExpression
            value: "/books/\\\d+.json"
          method: DELETE
EOF
We can then check that these HTTPRoutes have been accepted by their parent Service by checking their status subresource:
kubectl -n booksapp get httproutes.gateway.networking.k8s.io \
  -ojsonpath='{.items[*].status.parents[*].conditions[*]}' | jq .
Notice that the Accepted and ResolvedRefs conditions are True.
{
  "lastTransitionTime": "2024-08-03T01:38:25Z",
  "message": "",
  "reason": "Accepted",
  "status": "True",
  "type": "Accepted"
}
{
  "lastTransitionTime": "2024-08-03T01:38:25Z",
  "message": "",
  "reason": "ResolvedRefs",
  "status": "True",
  "type": "ResolvedRefs"
}
[...]
With those HTTPRoutes in place, we can look at the
outbound_http_route_backend_response_statuses_total metric again, and see that
the route labels have been populated:
linkerd diagnostics proxy-metrics -n booksapp po/webapp-pod-here \
| grep outbound_http_route_backend_response_statuses_total \
| grep http_status=\"500\"
outbound_http_route_backend_response_statuses_total{
  parent_group="core",
  parent_kind="Service",
  parent_namespace="booksapp",
  parent_name="books",
  parent_port="7002",
  parent_section_name="",
  route_group="gateway.networking.k8s.io",
  route_kind="HTTPRoute",
  route_namespace="booksapp",
  route_name="books-create",
  backend_group="core",
  backend_kind="Service",
  backend_namespace="booksapp",
  backend_name="books",
  backend_port="7002",
  backend_section_name="",
  http_status="500",
  error=""
} 212
This tells us that it is requests to the books-create HTTPRoute which have
been failing.
Retries
As it can take a while to update code and roll out a new version, let’s tell
Linkerd that it can retry requests to the failing endpoint. This will increase
request latencies, as requests will be retried multiple times, but not require
rolling out a new version. Add a retry annotation to the books-create
HTTPRoute which tells Linkerd to retry on 5xx responses:
kubectl -n booksapp annotate httproutes.gateway.networking.k8s.io/books-create \
retry.linkerd.io/http=5xx
We can then see the effect of these retries by looking at Linkerd’s retry metrics:
linkerd diagnostics proxy-metrics -n booksapp po/webapp-pod-here \
| grep outbound_http_route_backend_response_statuses_total \
| grep retry
outbound_http_route_retry_limit_exceeded_total{...} 222
outbound_http_route_retry_overflow_total{...} 0
outbound_http_route_retry_requests_total{...} 469
outbound_http_route_retry_successes_total{...} 247
This tells us that Linkerd made a total of 469 retry requests, of which 247 were successful. The remaining 222 failed and could not be retried again, since we didn’t raise the retry limit from its default of 1.
We can improve this further by increasing this limit to allow more than 1 retry per request:
kubectl -n booksapp annotate httproutes.gateway.networking.k8s.io/books-create \
retry.linkerd.io/limit=3
Over time you will see outbound_http_route_retry_requests_total and
outbound_http_route_retry_successes_total increase at a much higher rate than
outbound_http_route_retry_limit_exceeded_total.
Timeouts
Linkerd can limit how long to wait before failing outgoing requests to another
service. For the purposes of this demo, let’s set a 15ms timeout for calls to
the books-create route:
kubectl -n booksapp annotate httproutes.gateway.networking.k8s.io/books-create \
timeout.linkerd.io/request=15ms
(You may need to adjust the timeout value depending on your cluster – 15ms should definitely show some timeouts, but feel free to raise it if you’re getting so many that it’s hard to see what’s going on!)
We can see the effects of this timeout by running:
linkerd diagnostics proxy-metrics -n booksapp po/webapp-pod-here \
| grep outbound_http_route_request_statuses_total | grep books-create
outbound_http_route_request_statuses_total{
  [...]
  route_name="books-create",
  http_status="",
  error="REQUEST_TIMEOUT"
} 151
outbound_http_route_request_statuses_total{
  [...]
  route_name="books-create",
  http_status="201",
  error=""
} 5548
outbound_http_route_request_statuses_total{
  [...]
  route_name="books-create",
  http_status="500",
  error=""
} 3194
Clean Up
To remove the books app and the booksapp namespace from your cluster, run:
kubectl delete ns booksapp


