


Debugging HTTP applications with per-route metrics
This demo is of a Ruby application that helps you manage your bookshelf. It consists of multiple microservices and uses JSON over HTTP to communicate with the other services. There are three services:
webapp: the frontend
authors: an API to manage the authors in the system
books: an API to manage the books in the system
For demo purposes, the app comes with a simple traffic generator. The overall topology looks like this:

Prerequisites
To use this guide, you’ll need to have Linkerd and its Viz extension installed on your cluster. Follow the Installing Linkerd Guide if you haven’t already done this.
Install the app
To get started, let’s install the books app onto your cluster. In your local terminal, run:
kubectl create ns booksapp && \
  curl --proto '=https' --tlsv1.2 -sSfL https://run.linkerd.io/booksapp.yml \
  | kubectl -n booksapp apply -f -
This command creates a namespace for the demo, downloads its Kubernetes resource
manifest and uses kubectl to apply it to your cluster. The app comprises the
Kubernetes deployments and services that run in the booksapp namespace.
Downloading a bunch of containers for the first time takes a little while. Kubernetes can tell you when all the services are running and ready for traffic. Wait for that to happen by running:
kubectl -n booksapp rollout status deploy webapp
You can also take a quick look at all the components that were added to your cluster by running:
kubectl -n booksapp get all
Once the rollout has completed successfully, you can access the app itself by
port-forwarding webapp locally:
kubectl -n booksapp port-forward svc/webapp 7000 &
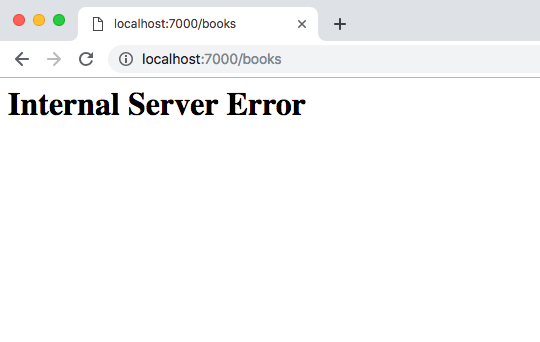
Open http://localhost:7000/ in your browser to see the frontend.
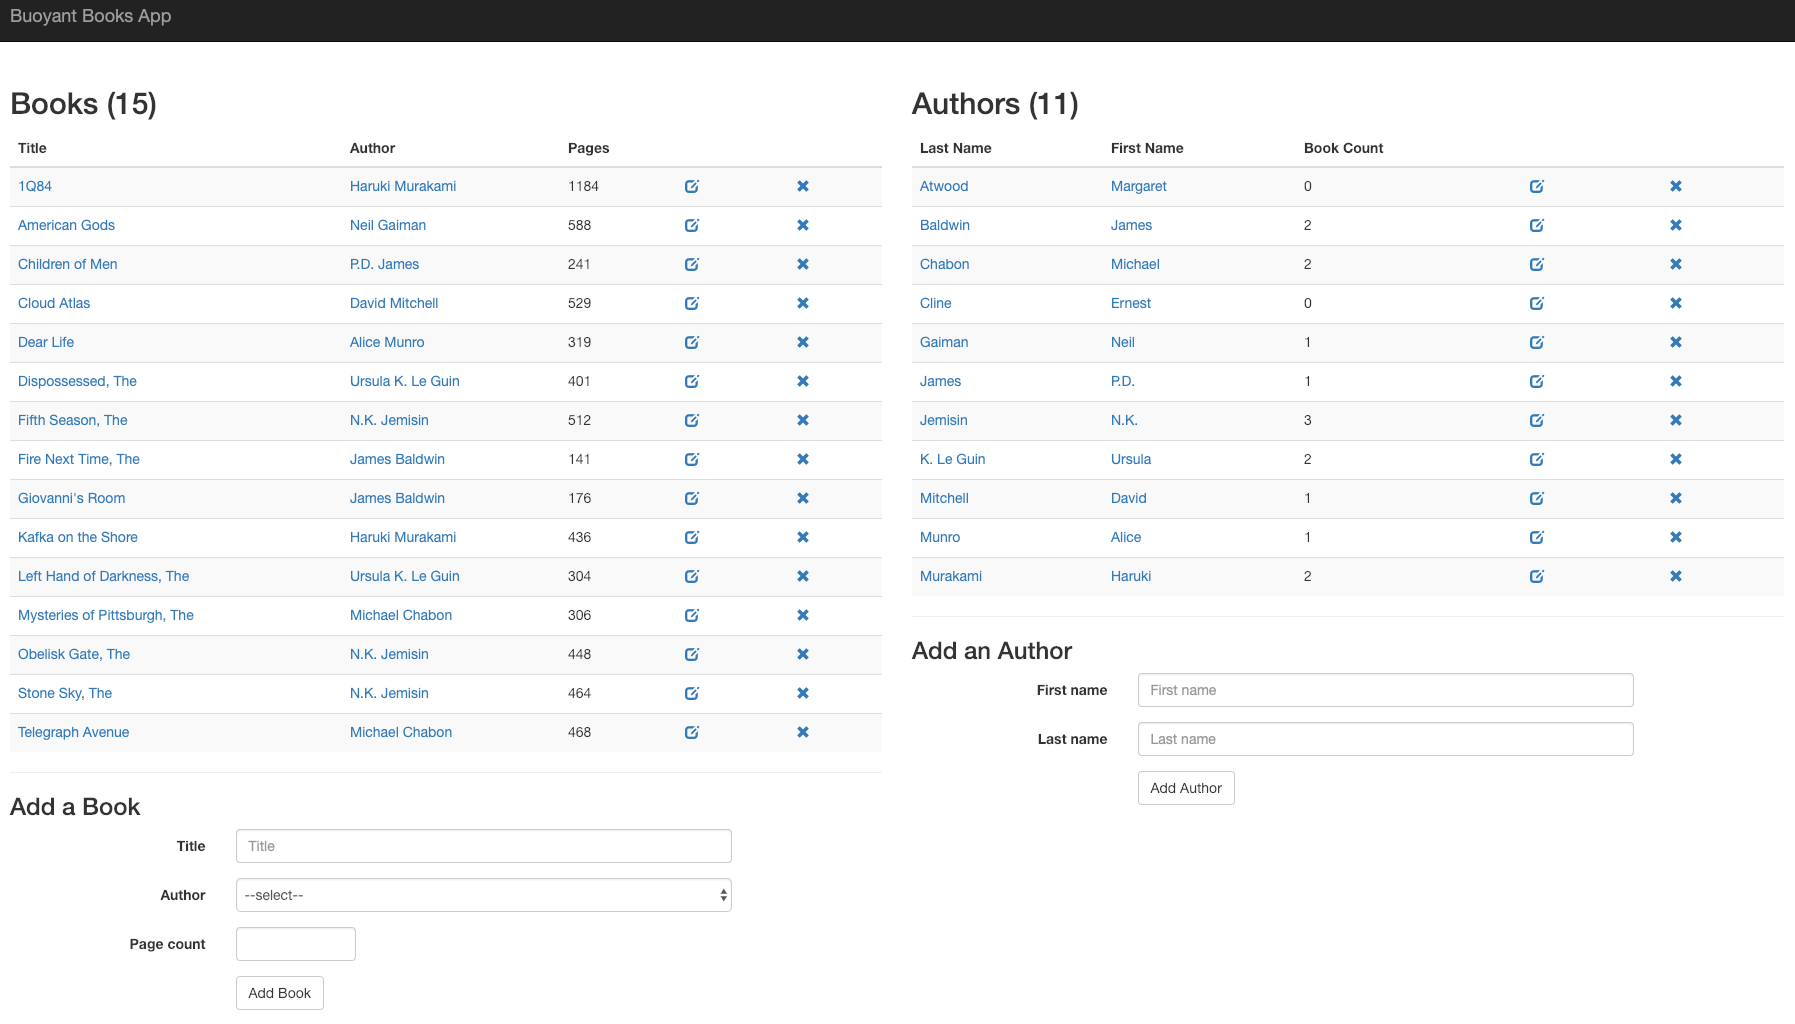
Unfortunately, there is an error in the app: if you click Add Book, it will fail 50% of the time. This is a classic case of non-obvious, intermittent failure—the type that drives service owners mad because it is so difficult to debug. Kubernetes itself cannot detect or surface this error. From Kubernetes’s perspective, it looks like everything’s fine, but you know the application is returning errors.
Add Linkerd to the service
Now we need to add the Linkerd data plane proxies to the service. The easiest option is to do something like this:
kubectl get -n booksapp deploy -o yaml \
  | linkerd inject - \
  | kubectl apply -f -
This command retrieves the manifest of all deployments in the booksapp
namespace, runs them through linkerd inject, and then re-applies with
kubectl apply. The linkerd inject command annotates each resource to specify
that they should have the Linkerd data plane proxies added, and Kubernetes does
this when the manifest is reapplied to the cluster. Best of all, since
Kubernetes does a rolling deploy, the application stays running the entire time.
(See Automatic Proxy Injection for more details
on how this works.)
Debugging
Let’s use Linkerd to discover the root cause of this app’s failures. To check out the Linkerd dashboard, run:
linkerd viz dashboard &
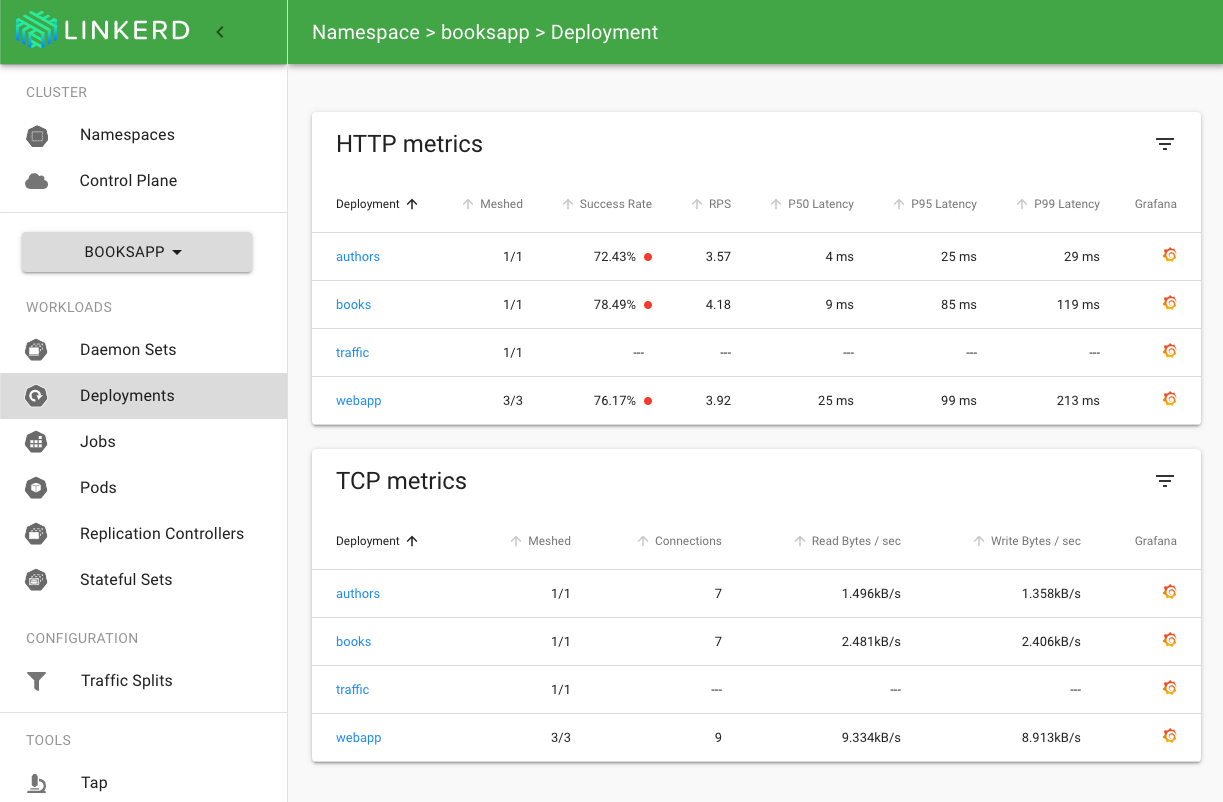
Select booksapp from the namespace dropdown and click on the
Deployments workload.
You should see all the deployments in the booksapp namespace show up. There
will be success rate, requests per second, and latency percentiles.
That’s cool, but you’ll notice that the success rate for webapp is not 100%.
This is because the traffic generator is submitting new books. You can do the
same thing yourself and push that success rate even lower. Click on webapp in
the Linkerd dashboard for a live debugging session.
You should now be looking at the detail view for the webapp service. You’ll
see that webapp is taking traffic from traffic (the load generator), and it
has two outgoing dependencies: authors and book. One is the service for
pulling in author information and the other is the service for pulling in book
information.
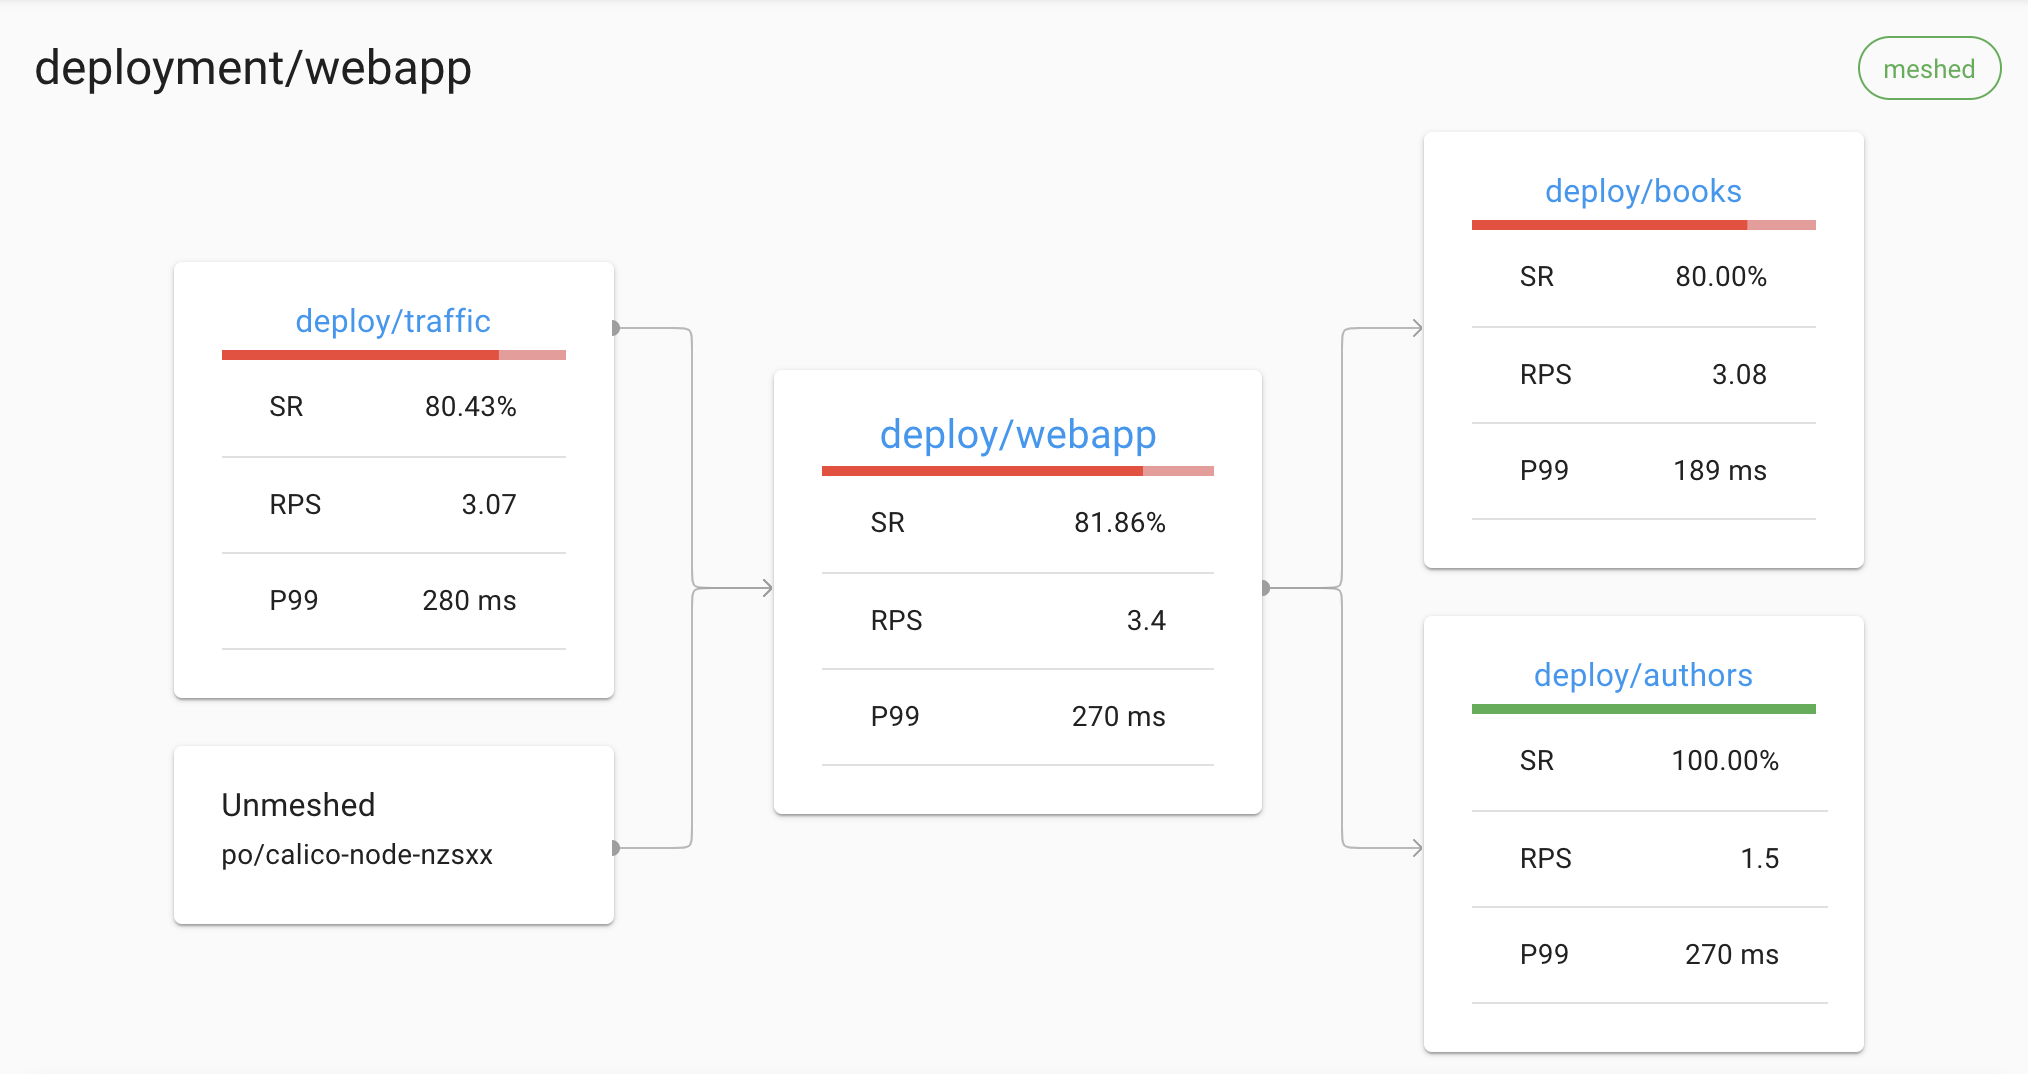
A failure in a dependent service may be exactly what’s causing the errors that
webapp is returning (and the errors you as a user can see when you click). We
can see that the books service is also failing. Let’s scroll a little further
down the page, we’ll see a live list of all traffic endpoints that webapp is
receiving. This is interesting:
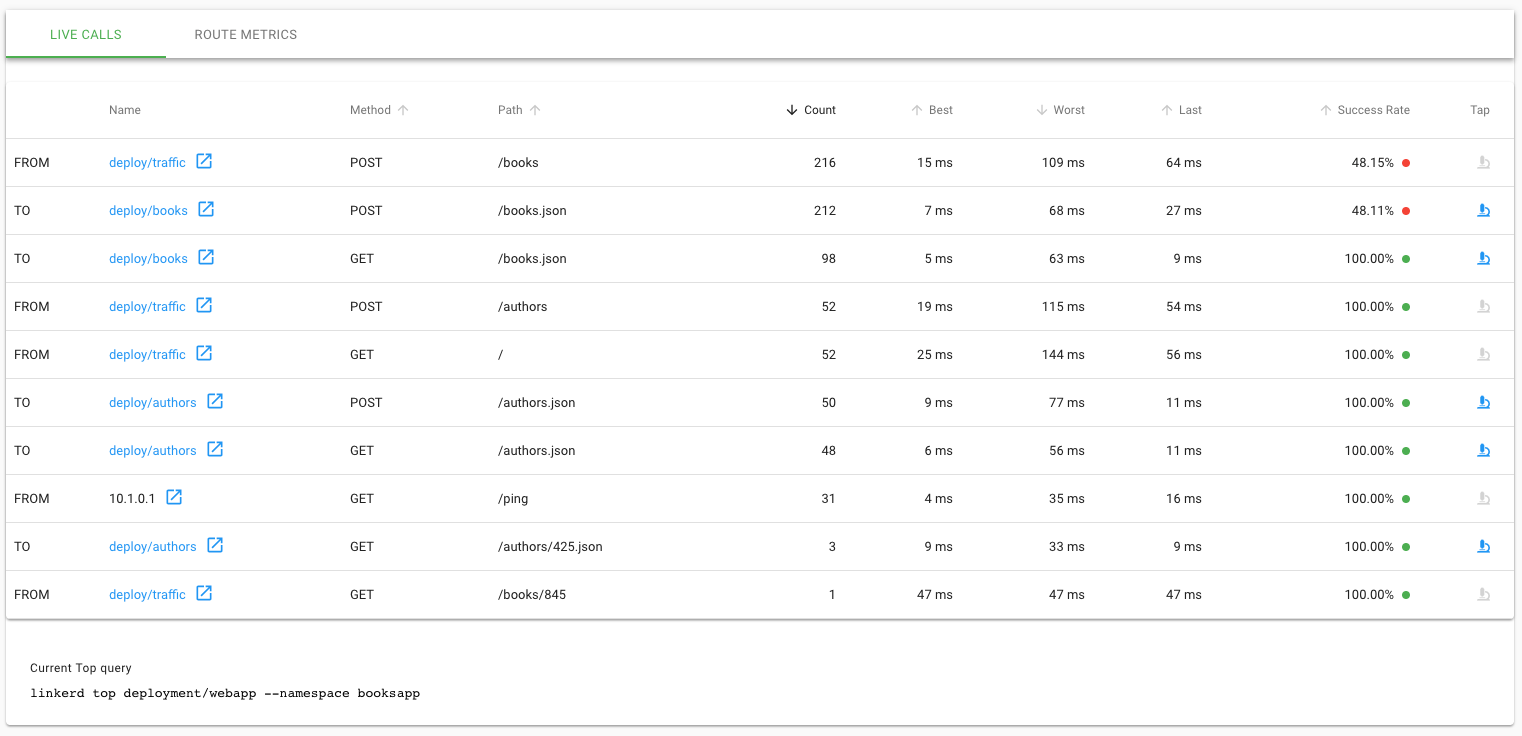
Aha! We can see that inbound traffic coming from the webapp service going to
the books service is failing a significant percentage of the time. That could
explain why webapp was throwing intermittent failures. Let’s click on the tap
(🔬) icon and then on the Start button to look at the actual request and
response stream.
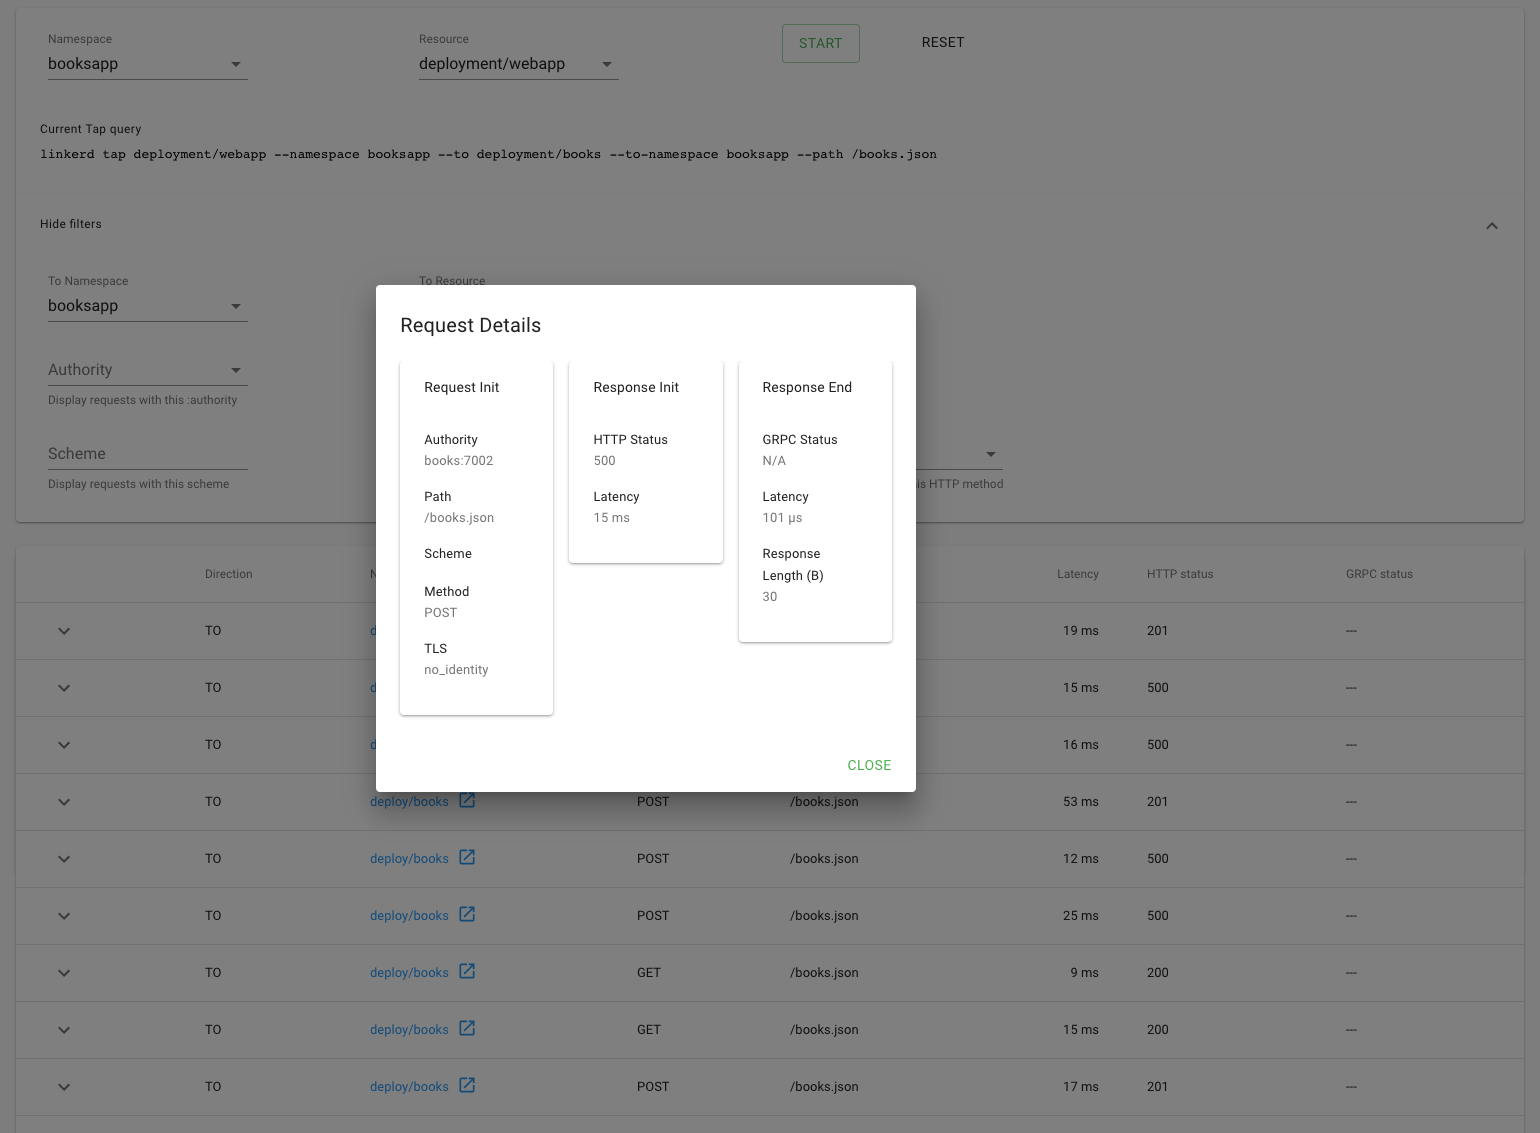
Indeed, many of these requests are returning 500’s.
It was surprisingly easy to diagnose an intermittent issue that affected only a
single route. You now have everything you need to open a detailed bug report
explaining exactly what the root cause is. If the books service was your own,
you know exactly where to look in the code.
Service Profiles
To understand the root cause, we used live traffic. For some issues this is great, but what happens if the issue is intermittent and happens in the middle of the night? Service profiles provide Linkerd with some additional information about your services. These define the routes that you’re serving and, among other things, allow for the collection of metrics on a per route basis. With Prometheus storing these metrics, you’ll be able to sleep soundly and look up intermittent issues in the morning.
One of the easiest ways to get service profiles setup is by using existing
OpenAPI (Swagger) specs. This
demo has published specs for each of its services. You can create a service
profile for webapp by running:
curl --proto '=https' --tlsv1.2 -sSfL https://run.linkerd.io/booksapp/webapp.swagger \
  | linkerd -n booksapp profile --open-api - webapp \
  | kubectl -n booksapp apply -f -
This command will do three things:
- Fetch the swagger specification for
webapp. - Take the spec and convert it into a service profile by using the
profilecommand. - Apply this configuration to the cluster.
Alongside install and inject, profile is also a pure text operation. Check
out the profile that is generated:
apiVersion: linkerd.io/v1alpha2
kind: ServiceProfile
metadata:
  creationTimestamp: null
  name: webapp.booksapp.svc.cluster.local
  namespace: booksapp
spec:
  routes:
    - condition:
        method: GET
        pathRegex: /
      name: GET /
    - condition:
        method: POST
        pathRegex: /authors
      name: POST /authors
    - condition:
        method: GET
        pathRegex: /authors/[^/]*
      name: GET /authors/{id}
    - condition:
        method: POST
        pathRegex: /authors/[^/]*/delete
      name: POST /authors/{id}/delete
    - condition:
        method: POST
        pathRegex: /authors/[^/]*/edit
      name: POST /authors/{id}/edit
    - condition:
        method: POST
        pathRegex: /books
      name: POST /books
    - condition:
        method: GET
        pathRegex: /books/[^/]*
      name: GET /books/{id}
    - condition:
        method: POST
        pathRegex: /books/[^/]*/delete
      name: POST /books/{id}/delete
    - condition:
        method: POST
        pathRegex: /books/[^/]*/edit
      name: POST /books/{id}/edit
The name refers to the FQDN of your Kubernetes service,
webapp.booksapp.svc.cluster.local in this instance. Linkerd uses the Host
header of requests to associate service profiles with requests. When the proxy
sees a Host header of webapp.booksapp.svc.cluster.local, it will use that to
look up the service profile’s configuration.
Routes are simple conditions that contain the method (GET for example) and a
regex to match the path. This allows you to group REST style resources together
instead of seeing a huge list. The names for routes can be whatever you’d like.
For this demo, the method is appended to the route regex.
To get profiles for authors and books, you can run:
curl --proto '=https' --tlsv1.2 -sSfL https://run.linkerd.io/booksapp/authors.swagger \
  | linkerd -n booksapp profile --open-api - authors \
  | kubectl -n booksapp apply -f -
curl --proto '=https' --tlsv1.2 -sSfL https://run.linkerd.io/booksapp/books.swagger \
  | linkerd -n booksapp profile --open-api - books \
  | kubectl -n booksapp apply -f -
Verifying that this all works is easy when you use linkerd viz tap. Each live
request will show up with what :authority or Host header is being seen as
well as the :path and rt_route being used. Run:
linkerd viz tap -n booksapp deploy/webapp -o wide | grep req
This will watch all the live requests flowing through webapp and look
something like:
req id=0:1 proxy=in src=10.1.3.76:57152 dst=10.1.3.74:7000 tls=true :method=POST :authority=webapp.default:7000 :path=/books/2878/edit src_res=deploy/traffic src_ns=booksapp dst_res=deploy/webapp dst_ns=booksapp rt_route=POST /books/{id}/edit
As you can see:
:authorityis the correct host:pathcorrectly matchesrt_routecontains the name of the route
These metrics are part of the
linkerd viz routes command instead of
linkerd viz stat. To see the metrics that have
accumulated so far, run:
linkerd viz -n booksapp routes svc/webapp
This will output a table of all the routes observed and their golden metrics.
The [DEFAULT] route is a catch all for anything that does not match the
service profile.
Profiles can be used to observe outgoing requests as well as incoming requests. To do that, run:
linkerd viz -n booksapp routes deploy/webapp --to svc/books
This will show all requests and routes that originate in the webapp deployment
and are destined to the books service. Similarly to using tap and top
views in the debugging section, the root cause of errors in this
demo is immediately apparent:
ROUTE                     SERVICE   SUCCESS      RPS   LATENCY_P50   LATENCY_P95   LATENCY_P99
DELETE /books/{id}.json     books   100.00%   0.5rps          18ms          29ms          30ms
GET /books.json             books   100.00%   1.1rps           7ms          12ms          18ms
GET /books/{id}.json        books   100.00%   2.5rps           6ms          10ms          10ms
POST /books.json            books    52.24%   2.2rps          23ms          34ms          39ms
PUT /books/{id}.json        books    41.98%   1.4rps          73ms          97ms          99ms
[DEFAULT]                   books         -        -             -             -             -
Retries
As it can take a while to update code and roll out a new version, let’s tell Linkerd that it can retry requests to the failing endpoint. This will increase request latencies, as requests will be retried multiple times, but not require rolling out a new version.
In this application, the success rate of requests from the books deployment to
the authors service is poor. To see these metrics, run:
linkerd viz -n booksapp routes deploy/books --to svc/authors
The output should look like:
ROUTE                       SERVICE   SUCCESS      RPS   LATENCY_P50   LATENCY_P95   LATENCY_P99
DELETE /authors/{id}.json   authors         -        -             -             -             -
GET /authors.json           authors         -        -             -             -             -
GET /authors/{id}.json      authors         -        -             -             -             -
HEAD /authors/{id}.json     authors    50.85%   3.9rps           5ms          10ms          17ms
POST /authors.json          authors         -        -             -             -             -
[DEFAULT]                   authors         -        -             -             -             -
One thing that’s clear is that all requests from books to authors are to the
HEAD /authors/{id}.json route and those requests are failing about 50% of the
time.
To correct this, let’s edit the authors service profile and make those requests retryable by running:
kubectl -n booksapp edit sp/authors.booksapp.svc.cluster.local
You’ll want to add isRetryable to a specific route. It should look like:
spec:
  routes:
    - condition:
        method: HEAD
        pathRegex: /authors/[^/]*\.json
      name: HEAD /authors/{id}.json
      isRetryable: true ### ADD THIS LINE ###
After editing the service profile, Linkerd will begin to retry requests to this route automatically. We see a nearly immediate improvement in success rate by running:
linkerd viz -n booksapp routes deploy/books --to svc/authors -o wide
This should look like:
ROUTE                       SERVICE   EFFECTIVE_SUCCESS   EFFECTIVE_RPS   ACTUAL_SUCCESS   ACTUAL_RPS   LATENCY_P50   LATENCY_P95   LATENCY_P99
DELETE /authors/{id}.json   authors                   -               -                -            -             -           0ms
GET /authors.json           authors                   -               -                -            -             -           0ms
GET /authors/{id}.json      authors                   -               -                -            -             -           0ms
HEAD /authors/{id}.json     authors             100.00%          2.8rps           58.45%       4.7rps           7ms          25ms          37ms
POST /authors.json          authors                   -               -                -            -             -           0ms
[DEFAULT]                   authors                   -               -                -            -             -           0ms
You’ll notice that the -o wide flag has added some columns to the routes
view. These show the difference between EFFECTIVE_SUCCESS and
ACTUAL_SUCCESS. The difference between these two show how well retries are
working. EFFECTIVE_RPS and ACTUAL_RPS show how many requests are being sent
to the destination service and and how many are being received by the client’s
Linkerd proxy.
With retries automatically happening now, success rate looks great but the p95 and p99 latencies have increased. This is to be expected because doing retries takes time.
Timeouts
Linkerd can limit how long to wait before failing outgoing requests to another service. These timeouts work by adding another key to a service profile’s routes configuration.
To get started, let’s take a look at the current latency for requests from
webapp to the books service:
linkerd viz -n booksapp routes deploy/webapp --to svc/books
This should look something like:
ROUTE                     SERVICE   SUCCESS      RPS   LATENCY_P50   LATENCY_P95   LATENCY_P99
DELETE /books/{id}.json     books   100.00%   0.7rps          10ms          27ms          29ms
GET /books.json             books   100.00%   1.3rps           9ms          34ms          39ms
GET /books/{id}.json        books   100.00%   2.0rps           9ms          52ms          91ms
POST /books.json            books   100.00%   1.3rps          45ms         140ms         188ms
PUT /books/{id}.json        books   100.00%   0.7rps          80ms         170ms         194ms
[DEFAULT]                   books         -        -             -             -             -
Requests to the books service’s PUT /books/{id}.json route include retries
for when that service calls the authors service as part of serving those
requests, as described in the previous section. This improves success rate, at
the cost of additional latency. For the purposes of this demo, let’s set a 25ms
timeout for calls to that route. Your latency numbers will vary depending on the
characteristics of your cluster. To edit the books service profile, run:
kubectl -n booksapp edit sp/books.booksapp.svc.cluster.local
Update the PUT /books/{id}.json route to have a timeout:
spec:
  routes:
    - condition:
        method: PUT
        pathRegex: /books/[^/]*\.json
      name: PUT /books/{id}.json
      timeout: 25ms ### ADD THIS LINE ###
Linkerd will now return errors to the webapp REST client when the timeout is
reached. This timeout includes retried requests and is the maximum amount of
time a REST client would wait for a response.
Run routes to see what has changed:
linkerd viz -n booksapp routes deploy/webapp --to svc/books -o wide
With timeouts happening now, the metrics will change:
ROUTE                     SERVICE   EFFECTIVE_SUCCESS   EFFECTIVE_RPS   ACTUAL_SUCCESS   ACTUAL_RPS   LATENCY_P50   LATENCY_P95   LATENCY_P99
DELETE /books/{id}.json     books             100.00%          0.7rps          100.00%       0.7rps           8ms          46ms          49ms
GET /books.json             books             100.00%          1.3rps          100.00%       1.3rps           9ms          33ms          39ms
GET /books/{id}.json        books             100.00%          2.2rps          100.00%       2.2rps           8ms          19ms          28ms
POST /books.json            books             100.00%          1.3rps          100.00%       1.3rps          27ms          81ms          96ms
PUT /books/{id}.json        books              86.96%          0.8rps          100.00%       0.7rps          75ms          98ms         100ms
[DEFAULT]                   books                   -               -                -            -             -
The latency numbers include time spent in the webapp application itself, so
it’s expected that they exceed the 25ms timeout that we set for requests from
webapp to books. We can see that the timeouts are working by observing that
the effective success rate for our route has dropped below 100%.
Clean Up
To remove the books app and the booksapp namespace from your cluster, run:
curl --proto '=https' --tlsv1.2 -sSfL https://run.linkerd.io/booksapp.yml \
  | kubectl -n booksapp delete -f - \
  && kubectl delete ns booksapp
