

One of the most common feature requests for Linkerd 2.x is distributed tracing. We’re happy to report that this feature is on the near-term Linkerd roadmap. Unfortunately, we’ve found that many of the people asking for this feature don’t quite understand what they’re asking for.
A few weeks ago we conducted a Twitter survey to understand why people were asking for distributed tracing. This was highly unscientific–64 respondents, advertised purely on Twitter, not peer reviewed, etc–but the results suggested some common misunderstandings of what distributed tracing support in a service mesh would actually provide, and what it would require from them to be useful.
These misunderstandings can be characterized as a set of myths, which I’ll dispel below.
Myth 1: I need distributed tracing to measure the health / latency / throughput of my services
False. Many respondents suggested that measuring service success rate, latency, etc was a desired use case for distributed tracing in the service mesh. While this is a possible use of distributed tracing data when a service mesh is not in place, the service mesh itself already provides these metrics, and arguably does so in a way that’s better than what can be achieved with distributed tracing. (No sampling, no code changes required.)
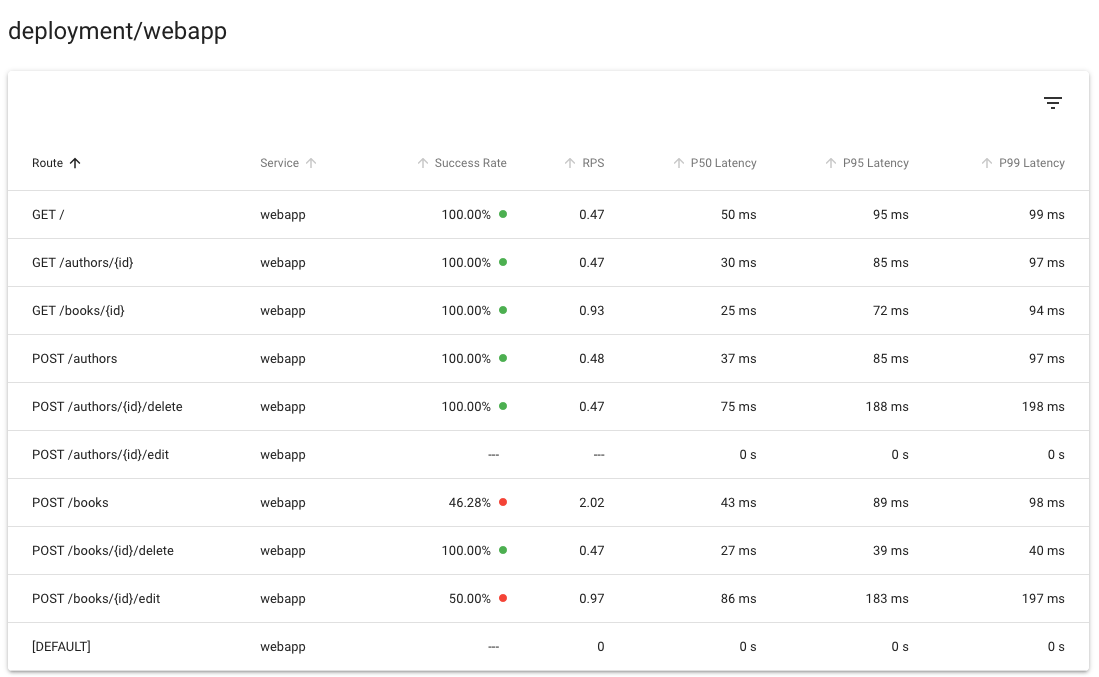
For example, Linkerd provides success rate, throughput, and latency distributions per service (as well as per route, per client per service, per client per route, etc) from metrics data, and the Linkerd dashboard and CLI report this data today:
Myth 2: I need distributed tracing to see which services talk to which other services
False. Many respondents suggested that drawing a service topology was a desired use of distributed tracing in a service mesh. Again, while this is a role that distributed tracing can provide outside of a service mesh, the service mesh can detect and display these relationships purely from metrics data, again without requiring any application-level changes.
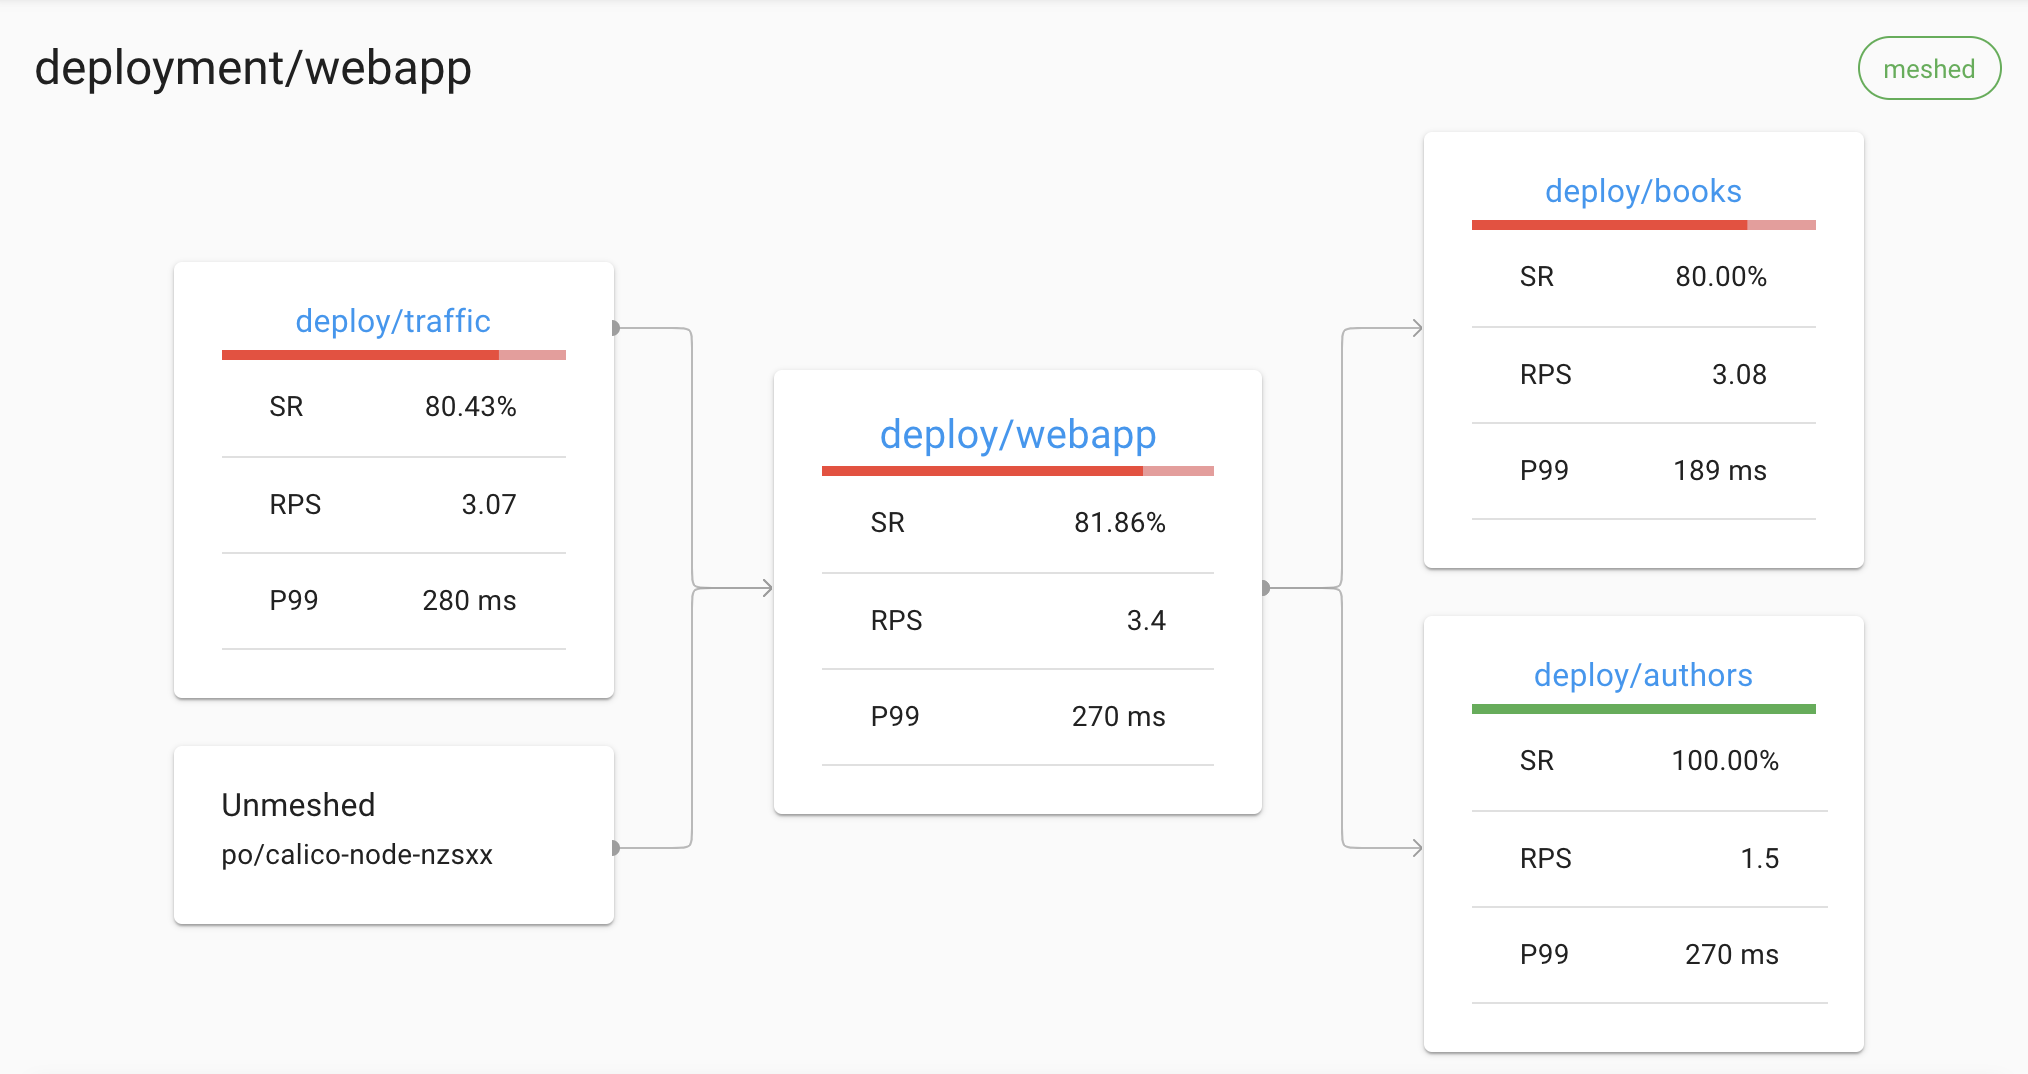
For example, the Linkerd dashboard displays the set of upstream and downstream Kubernetes deployments on the deployment detail page:
Myth 3: I can “get distributed tracing” from the service mesh without having to make any changes to my application
False. Many respondents answered that they would not expect to need any application changes once Linkerd added distributed tracing support. Unfortunately, while a service mesh can emit trace spans from the proxies, the application will need to propagate headers in order for these spans to be pulled together into traces–i.e. copy any distributed tracing header that is attached to an incoming request to each resulting outgoing request.
In other words, in contrast to nearly every other service mesh feature, distributed tracing mesh can only work if developers make changes to their code. Note that this isn’t a flaw with Linkerd; this is a function of the sidecar proxy model and is true of any sidecar-based service mesh.
Myth 4: I can “get distributed tracing” from a service mesh by instrumenting my application with a distributed tracing library
Sort of true. Some respondents answered that they would make use of distributed tracing in Linkerd by instrumenting their applications with a distributed tracing library. It’s true that these libraries will make it easy to propagate the headers, thus accomplishing the development work you need to do to make use of distributed tracing. But once you’re at this point, you have distributed tracing, regardless of whether the service mesh “supports distributed tracing” or not! (Of course, Linkerd support will add some important data–see below.)
What does distributed tracing support in a service mesh actually get you?
If you’ve decided you want distributed tracing, and you are willing and able to modify your application to support it, then what distributed tracing support at the service mesh level actually gets you is:
- Proxy timing and data in your traces. This can be helpful for understanding how much latency for particular requests is coming from the proxy. (Happily, Linkerd is very, very fast, but nothing is free.)
- Traces that extend to ingress points. This can be helpful for painting a more complete picture of how time is spent on particular requests.
- Distributed tracing functionality without needing to couple application code to a particular library. This is helpful if you don’t want to commit to a particular library, or don’t have library support in the languages you need.
Those are all valuable features, certainly, but they’re a far cry from some of the expectations we saw in the survey.
All that said, distributed tracing support is on the near-term roadmap for Linkerd 2.x. If this is a valuable feature for you in Linkerd 2.x, please leave a comment on that ticket saying as much–we’d love to hear from you.
Linkerd is a community project and is hosted by the Cloud Native Computing Foundation. If you have feature requests, questions, or comments, we’d love to have you join our rapidly-growing community! Linkerd is hosted on GitHub, and we have a thriving community on Slack, Twitter, and the mailing lists. Come and join the fun!
Special thanks to Alex Ellis, Matt Turner, and Alex Klemmer for reviewing drafts of this post. All errors are mine, not theirs.
(Image credit: Digital Vincent)